Understanding Day/Night Earth Simulator
Earth turns steadily, so every place is carried into sunlight and later carried away from it. The line between lit ground and dark ground is not a fixed mark on a map. It moves westward across the surface because Earth rotates eastward.
A full turn takes about twenty four hours, but the exact length of daylight depends on where a place sits on the globe. Near the equator, daytime changes only a little through the year. At higher latitudes, the change becomes much larger.
Sunrise is not simply the instant when a location reaches the bright half of the globe. The atmosphere bends sunlight slightly, so the Sun can be seen when it is still just below the geometric horizon. Mountains, buildings, and trees can delay the visible sunrise for a person on the ground.
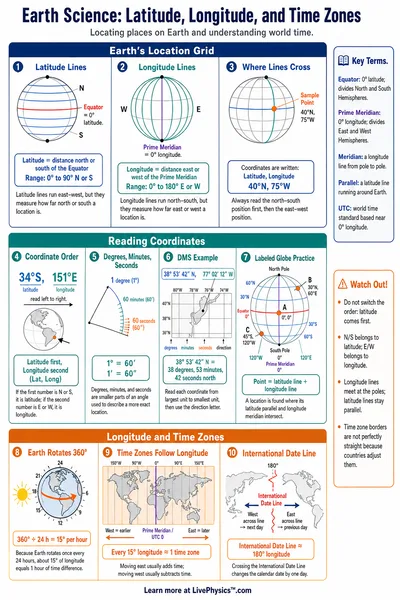
Sunset has similar effects. A simulator usually uses a smooth Earth surface, which is useful for seeing the large pattern but cannot include every local obstruction. Time zones are human choices, so clock time for sunrise may differ from the solar pattern near a zone boundary.
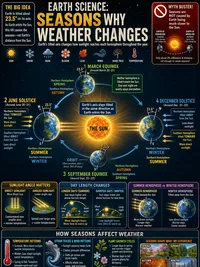
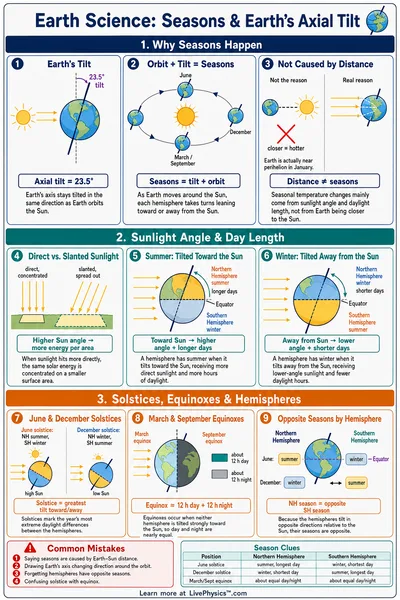
The yearly change in daylight comes from the direction Earth points as it travels around the Sun. The axis keeps nearly the same direction in space during the orbit. For part of the year, one hemisphere receives more direct sunlight and stays in the lit half for longer each day.
Direct sunlight delivers more energy to a smaller area, which helps warm the surface. Long days alone do not make temperatures change instantly because oceans, land, and air store heat and release it slowly.
At very high latitudes, the seasonal pattern can become extreme. A location may remain in daylight for many days during its local summer, then remain dark for many days during its local winter. This does not mean the Sun is always high overhead.
During continuous daylight, it may circle low near the horizon. When using the globe, compare places on the same latitude first, then compare places at different latitudes.
Notice how the path of the boundary changes with date, and check whether a location enters daylight at a steep angle or a shallow angle. A shallow crossing usually means sunrise or sunset is changing slowly from one day to the next.