Practice finding and interpreting mean, median, mode, range, quartiles, and simple data displays.
Read each problem carefully. Show your work in the space provided. When needed, organize the data from least to greatest before calculating.
Summarizing data with measures of center and spread
Statistics - Grade 6-8
- 1
The numbers of books read by 7 students last month were 3, 5, 2, 8, 5, 4, and 1. Find the mean number of books read.
- 2
The test scores for a small group were 84, 91, 78, 84, 95, and 88. Find the median score.
- 3
The daily high temperatures for one week were 72, 75, 70, 72, 68, 75, and 72 degrees Fahrenheit. Find the mode.
- 4
The numbers of points scored by a basketball team in 5 games were 42, 55, 48, 60, and 50. Find the range.
- 5
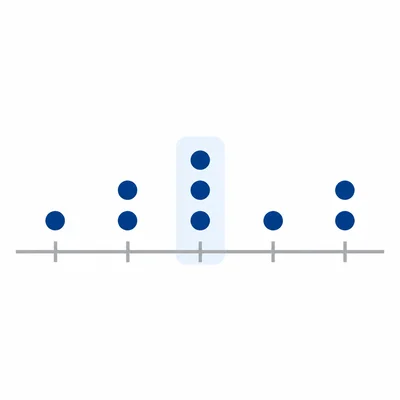
A dot plot shows the number of pets owned by students in a class. The data values are 0, 1, 1, 2, 2, 2, 3, 4, and 4. What is the median number of pets?
- 6
The table shows the number of minutes 6 students spent practicing piano: Ana 20, Ben 35, Cara 25, Diego 40, Ella 35, and Finn 25. Find the mean practice time.
- 7
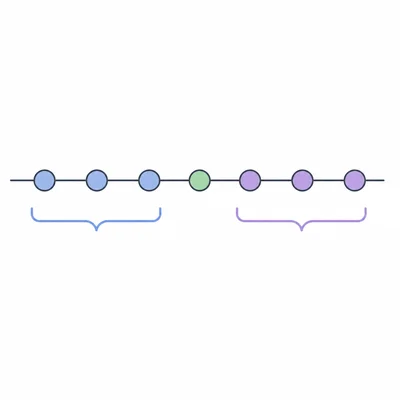
The data set is 6, 9, 12, 12, 15, 18, 24. Find the first quartile, third quartile, and interquartile range.
- 8
A runner recorded these mile times in minutes: 8.5, 8.2, 8.8, 8.4, 8.2, and 8.7. Find the mode and explain what it means.
- 9
The numbers of text messages sent by 8 students in one day were 14, 22, 35, 18, 22, 40, 16, and 25. Find the median.
- 10
A teacher recorded quiz scores: 10, 9, 8, 10, 7, 9, 10, and 5. Which measure of center, mean or median, is more affected by the score of 5? Explain.
- 11
The stem-and-leaf plot represents ages at a community art class. Stem 1 has leaves 1, 2, 5, 8. Stem 2 has leaves 0, 3, 3, 7. Stem 3 has leaf 1. The key is 1 | 5 = 15. How many people are represented, and what is the range of ages?
- 12
The number of goals scored in 9 soccer games was 1, 0, 3, 2, 2, 4, 1, 2, and 5. Find the mean, median, and mode.
- 13
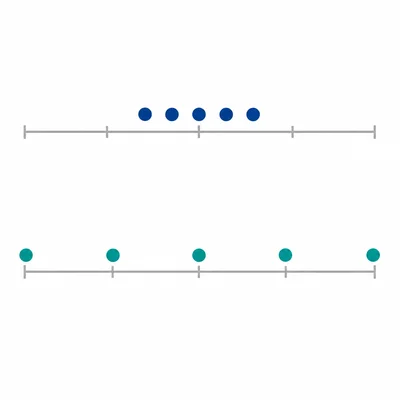
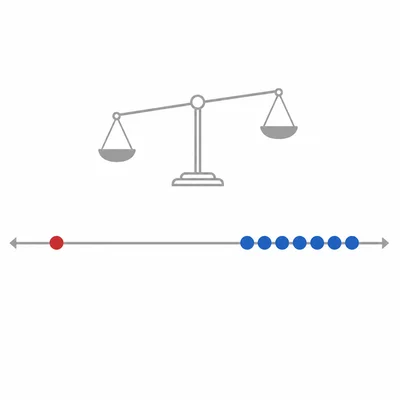
Two data sets show the number of minutes students spent reading. Set A: 10, 12, 13, 15, 15. Set B: 3, 10, 13, 20, 34. Both sets have the same median. Which set has the greater range, and what does that tell you?
- 14
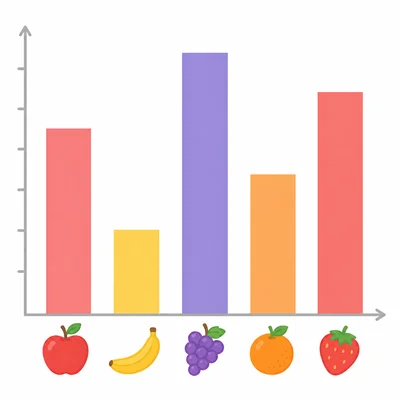
A bar graph shows the number of students who chose each favorite fruit: apples 6, bananas 4, grapes 8, oranges 5, and strawberries 7. What is the total number of students, and which fruit is the mode category?
- 15
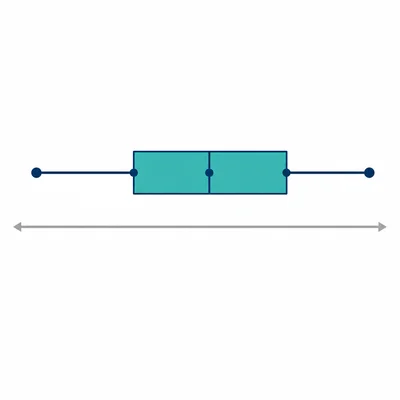
The data set 4, 6, 7, 9, 10, 12, 14, 18 represents hours spent on a project by 8 students. Find the five-number summary: minimum, first quartile, median, third quartile, and maximum.