Practice finding the range of a data set and identifying outliers that are much different from the other values.
Read each problem carefully. Find the greatest and least values when needed. Show your work in the space provided.
Finding spread and spotting unusual data values
Statistics - Grade 4-5
- 1
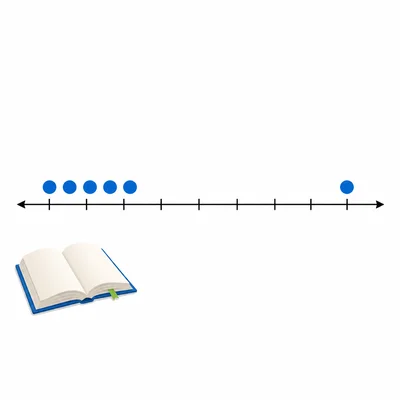
The numbers of books read by five students are 4, 6, 8, 5, and 7. What is the range of the data set?
- 2

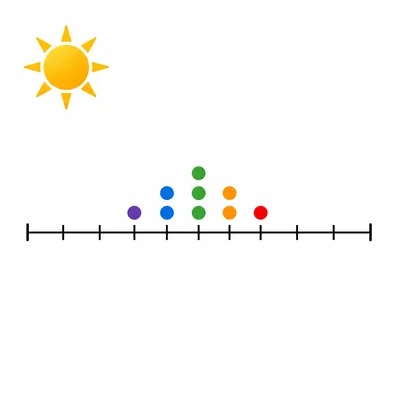
The heights of six plants in centimeters are 12, 14, 13, 15, 50, and 14. Which value is an outlier? Explain why.
- 3
A soccer team scored these points in six games: 2, 3, 1, 4, 2, and 3. Find the range.
- 4
The times, in minutes, for students to finish a puzzle are 9, 10, 11, 12, 10, and 45. What is the outlier, and how would removing it change the range?
- 5
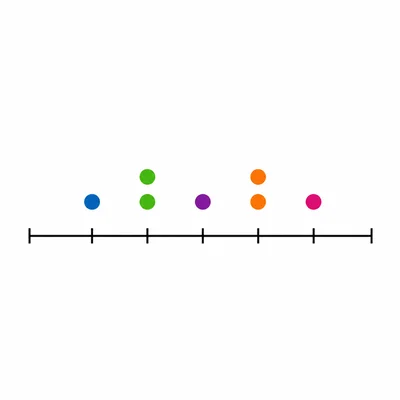
The daily high temperatures in degrees Fahrenheit were 70, 72, 69, 71, 73, and 72. Is there an outlier? Explain your answer.
- 6

Mia counted the number of jump ropes in different bins: 8, 9, 7, 8, 30, and 9. Find the range of the data set and name the outlier.
- 7
A class recorded the number of sunny days each month: 20, 18, 19, 21, 17, and 20. What is the range?
- 8

Look at this data set of pet weights in pounds: 9, 10, 11, 10, 42, and 12. Which number is an outlier? Explain what makes it unusual.
- 9
The ages of cousins at a picnic are 6, 7, 8, 9, 7, and 8. Find the range and tell whether there is an outlier.
- 10
The scores on a 20-point quiz were 16, 17, 18, 17, 19, and 3. What is the outlier, and what is the range?
- 11

A store sold these numbers of notebooks each day: 24, 26, 25, 27, 23, 25, and 26. Find the range.
- 12
The number of minutes spent reading each night were 22, 25, 24, 23, 80, and 25. How does the outlier affect the range?
- 13

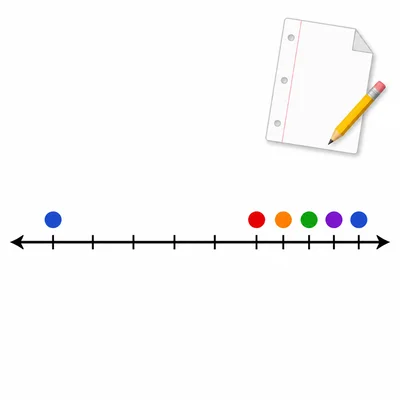
The lengths of pencils in centimeters are 14, 13, 15, 14, 2, and 13. Identify the outlier and find the range.
- 14
A teacher wrote two data sets on the board. Set A is 5, 6, 7, 8, 9. Set B is 5, 6, 7, 8, 30. Which set has the greater range, and why?
- 15
The number of stickers collected by seven students are 12, 15, 14, 13, 16, 15, and 14. Find the range and explain whether the data set has an outlier.