Practice analyzing time series data by identifying trends, seasonality, cycles, and unusual values.
Read each problem carefully. Use the data or description provided to identify patterns over time. Show your reasoning in the space provided.
Identifying patterns in data collected over time
Statistics - Grade 9-12
- 1
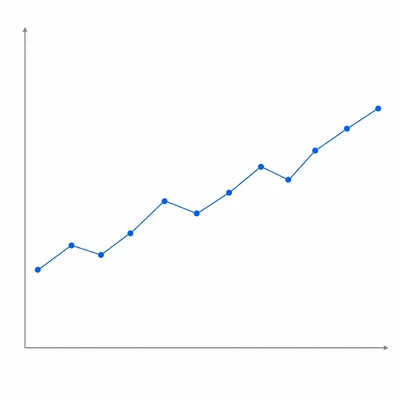
A store records its monthly sales for one year. Sales increase from January through December, with small ups and downs from month to month. Does this time series show a trend, seasonality, a cycle, or random variation? Explain your answer.
- 2
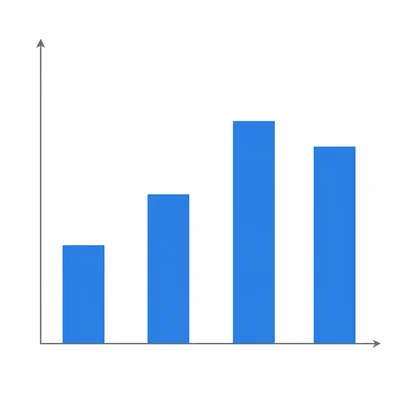
The table shows ice cream sales for four months: May: 120 cones, June: 180 cones, July: 260 cones, August: 240 cones. Describe the short-term pattern in the data.
- 3
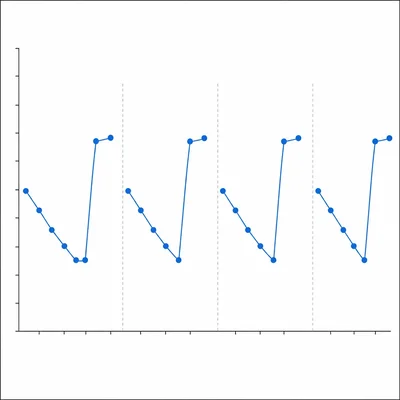
A website has more visitors every Friday and Saturday than on other days of the week. This pattern repeats each week. What type of time series pattern is this? Explain.
- 4
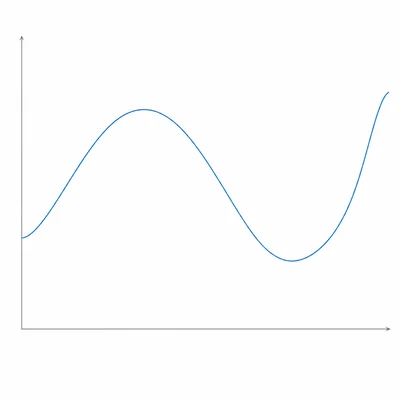
A local economy goes through several years of growth, then several years of decline, and then growth again. The timing is not exactly the same each time. Is this seasonality or a cycle? Explain.
- 5
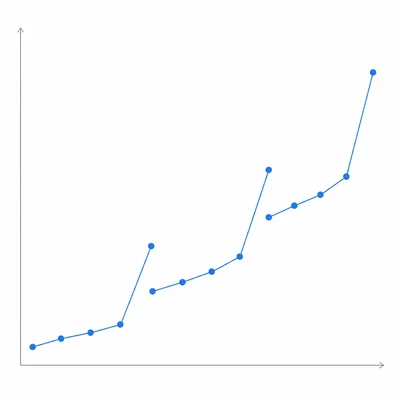
A company's quarterly revenue is shown: Year 1 Q1: 50, Q2: 60, Q3: 70, Q4: 110; Year 2 Q1: 55, Q2: 65, Q3: 75, Q4: 120; Year 3 Q1: 60, Q2: 70, Q3: 85, Q4: 130. Identify one trend and one seasonal pattern.
- 6
A time series has the values 10, 13, 15, 18, 20, 22, 25, 27. Find the approximate average change per time period from the first value to the last value.
- 7
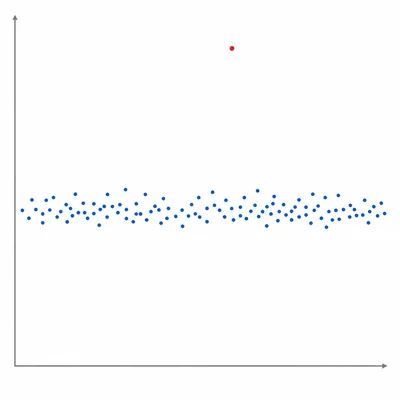
A school tracks daily absences for 30 school days. Most days have 20 to 25 absences, but one day has 70 absences during a flu outbreak. What term describes the value of 70, and how could it affect analysis?
- 8
The table shows monthly electricity use for a household: January: 900 kWh, February: 850 kWh, March: 700 kWh, April: 600 kWh, May: 650 kWh, June: 800 kWh, July: 1000 kWh, August: 1050 kWh, September: 850 kWh, October: 650 kWh, November: 700 kWh, December: 880 kWh. Describe the seasonal pattern.
- 9
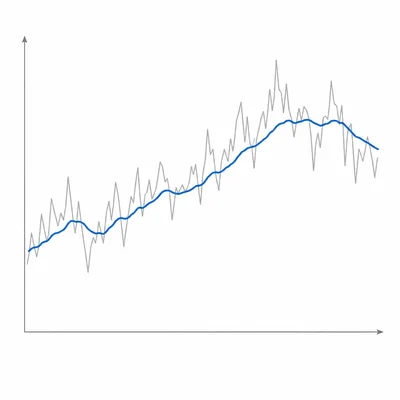
A moving average is often used in time series analysis. Explain why a 3-point moving average can help when data have random short-term fluctuations.
- 10
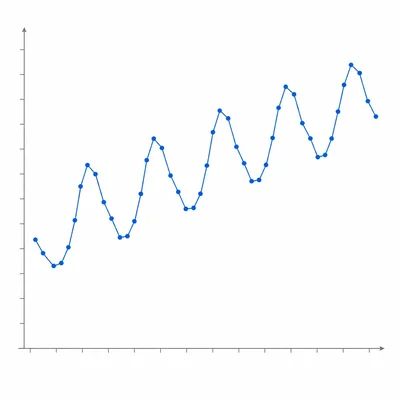
The number of bicycles sold at a shop is recorded each month for five years. Sales rise every spring and summer and fall every winter. Sales are also slowly increasing from year to year. What two patterns are present?
- 11
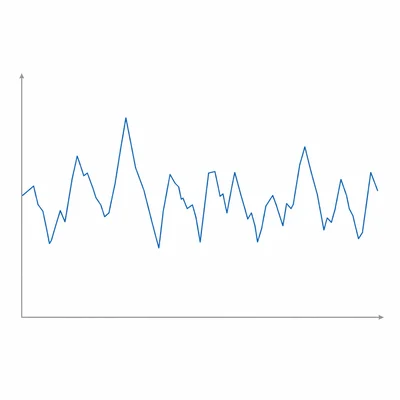
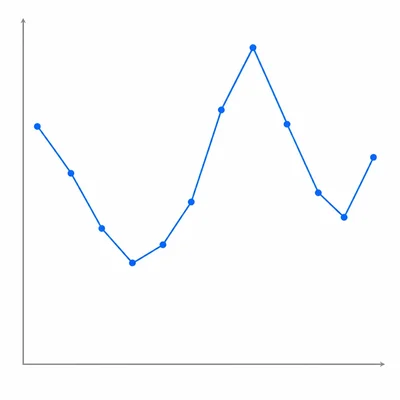
A stock price rises and falls many times over several months with no clear repeating pattern and no clear overall increase or decrease. Which pattern best describes this time series?
- 12
A city wants to forecast water use for next July. The data show that July water use has increased each year for the past 6 years, and July is always one of the highest-use months. What should the city consider when making its forecast?