Beer's Law & Spectrophotometry Lab
Choose a colored solution, set the molar absorptivity and cuvette path length, then build a calibration curve from known concentrations. The lab computes absorbance and percent transmittance for each standard, fits a linear trendline, and back-calculates the concentration of an unknown sample from a measured absorbance.
Guided Experiment Beer's Law Standard Curve
If you prepare solutions of KMnO₄ at concentrations from 0.0002 to 0.001 M, how do you predict absorbance will change as concentration increases? Will the relationship be linear?
Write your hypothesis in the Lab Report panel, then click Next.
Controls
λmax = 525 nm. Intense purple; common in titrations and water treatment
Results
| c (M) | A | %T |
|---|---|---|
| 2.00e-4 | 0.4800 | 33.11 |
| 4.00e-4 | 0.9600 | 10.96 |
| 6.00e-4 | 1.4400 | 3.63 |
| 8.00e-4 | 1.9200 | 1.20 |
| 1.00e-3 | 2.4000 | 0.40 |
Data Table
(0 rows)| # | Trial | Concentration (M) | Absorbance (A) | %T |
|---|
Reference Guide
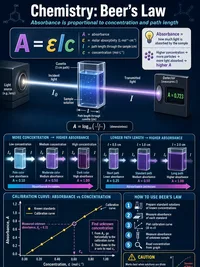
The Beer-Lambert Law
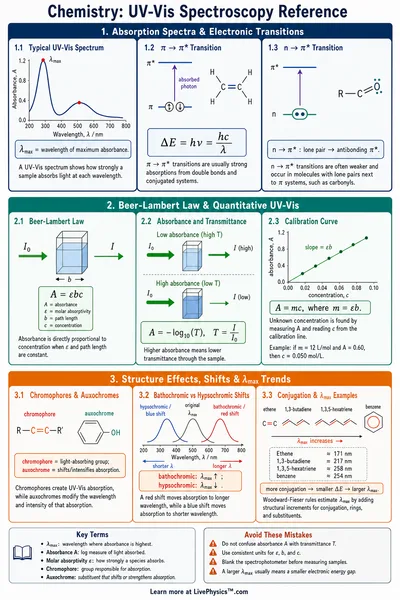
The Beer-Lambert Law relates the attenuation of light to the properties of the material it passes through. For a solution in a cuvette
where A is absorbance (dimensionless), ε (epsilon) is the molar absorptivity in M⁻¹cm⁻¹, b is the path length in cm, and c is the concentration in mol/L. Absorbance is directly proportional to concentration when ε and b are held constant.
Absorbance and Transmittance
Transmittance T is the fraction of incident light that passes through the sample. Percent transmittance %T = 100 T. Absorbance and transmittance are related by a base-10 logarithm
An absorbance of 1 corresponds to 10% transmittance. An absorbance of 2 means only 1% of light passes through. At A = 0 the solution is perfectly transparent (%T = 100).
Standard Curve and Calibration
A standard curve (calibration curve) is constructed by measuring the absorbance of several solutions of known concentration. Plotting A on the y-axis against c on the x-axis gives a straight line through the origin with slope equal to ε · b.
To find the concentration of an unknown sample, measure its absorbance and read the corresponding concentration from the standard curve, or use
Molar Absorptivity and Wavelength
The molar absorptivity ε is a molecular constant that describes how strongly a chemical species absorbs light at a given wavelength. It depends on the electronic structure of the molecule. Solutions should be measured at their wavelength of maximum absorbance (λmax) to maximise sensitivity.
KMnO₄ at 525 nm has ε ≈ 2400 M⁻¹cm⁻¹. FD&C Blue 1 at 630 nm has ε ≈ 130,000 M⁻¹cm⁻¹, so far lower concentrations are needed for the same absorbance reading.
Real-World Applications
Spectrophotometry is used across science and industry. In clinical labs, blood glucose, hemoglobin, and bilirubin are measured photometrically. Environmental chemists use Beer's Law to quantify nitrate, phosphate, and heavy metal contamination in water.
In biochemistry, protein concentrations are measured by the Bradford or BCA assay, and DNA/RNA purity is assessed at 260 nm and 280 nm. Industrial quality control uses spectrophotometry to verify dye concentrations in textiles, beverages, and pharmaceuticals.
Deviations from Beer's Law
Beer's Law assumes ideal conditions that break down at high concentrations. Above roughly 0.01 M, solute molecules begin to interact with each other, changing their effective absorptivity. The relationship between A and c curves downward, so the standard curve is no longer linear and the method becomes unreliable.
Instrumental deviations include stray light reaching the detector and non-monochromatic radiation. Stray light causes the absorbance to plateau at high concentrations, a common source of error in student experiments. Always work within the linear range of your standard curve (typically A between 0.1 and 1.5).