Understanding Phase Diagram & Heating Curve Explorer
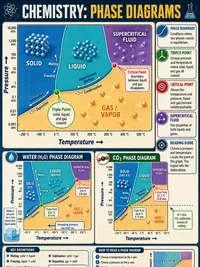
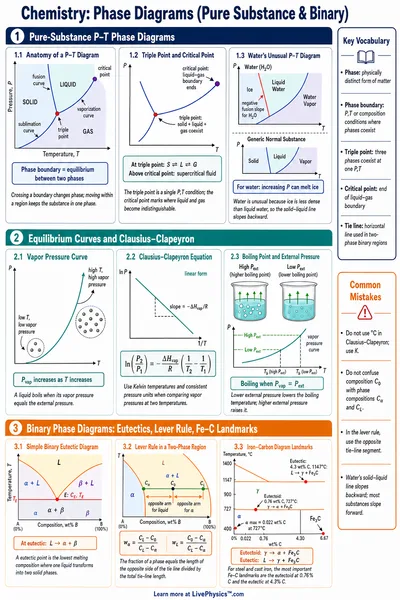
A phase diagram is a map of the physical state that is most stable under a particular temperature and pressure. Each region represents conditions where particles settle into a solid, liquid, or gas arrangement. The boundary lines matter because two phases can exist together there in balance.
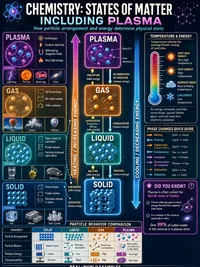
Temperature changes the average kinetic energy of particles. Pressure changes how strongly particles are pushed together. A gas usually occupies far more space than a liquid, so increasing pressure often favors the liquid state.
The solid-liquid boundary has an unusual slope for water. Ice takes up more volume than liquid water because its particles form an open crystal structure. Higher pressure can therefore help ice melt, which helps explain why pressure affects ice beneath a skate blade or glacier.
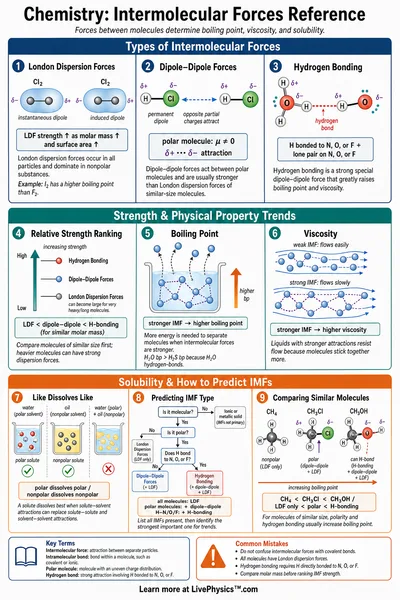
Most substances behave differently from water. Their solids are denser than their liquids, so pressure tends to raise their melting point. Comparing water, carbon dioxide, ethanol, and nitrogen shows that phase behavior depends on particle shape and intermolecular forces.
A triple point is a very specific temperature and pressure where solid, liquid, and gas all coexist. It is not a broad region where all three are mixed freely. This point gives scientists a precise reference for measuring temperature and testing models of matter.
Beyond the critical point, liquid and gas no longer have a visible boundary. The material becomes a supercritical fluid with properties of both states. Supercritical carbon dioxide is useful for extraction processes because it can move through materials like a gas while dissolving some substances like a liquid.
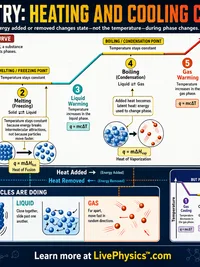
A heating curve tracks energy added at constant pressure. Sloped sections show that particle motion is speeding up, so temperature rises. Flat sections show that energy is separating particles or changing their arrangement instead of raising temperature.
The energy used during melting or boiling is called latent heat. Boiling generally needs more energy than melting because particles must separate much more completely. A long flat section on a heating curve therefore signals a large energy change during that phase change.
Boiling occurs when a liquid's vapor pressure matches the outside pressure. At high altitude, outside pressure is lower, so water boils at a lower temperature. Food can take longer to cook because boiling water is then less hot, even though it is visibly bubbling.
The Clausius-Clapeyron relationship connects a phase boundary's slope with temperature, pressure, and energy changes. It explains why a modest pressure change can noticeably shift a boiling point. Students should focus on the physical meaning before treating the relationship as a calculation rule.
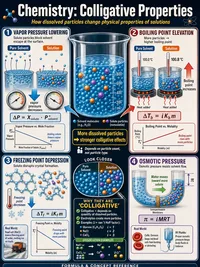
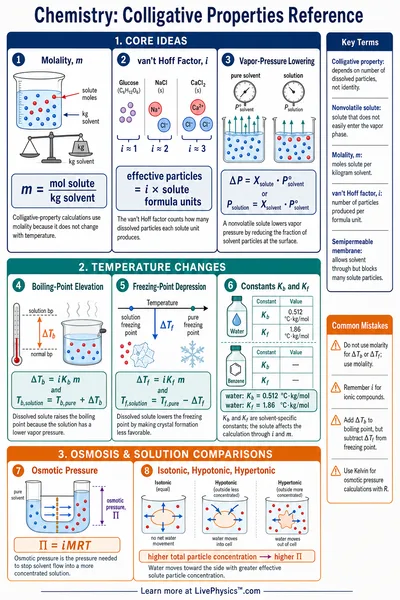
Dissolved particles can alter phase boundaries even when they do not evaporate with the solvent. Salt lowers water's freezing point because it disrupts the formation of an ordered ice crystal. The same basic particle effect raises the boiling point, though the increase is often small in everyday mixtures.
When reading any graph, check the axes, units, and direction of change before making a conclusion. A point exactly on a boundary means equilibrium between phases, not uncertainty in the data. Real samples may change slowly because nucleation, impurities, and heat transfer can delay a phase change.