Mark-Recapture Population Estimator
Count animals you cannot count directly. Catch and tag a first sample, release it, then catch a second sample and see how many tags come back. From those numbers you can estimate the size of the whole population and put a confidence interval around your answer.
Guided ExperimentDoes a bigger second capture shrink the confidence interval?
Keep the true population fixed and increase the second capture C. Predict what will happen to the number of recaptures R, to the Chapman estimate, and to the width of the 95 percent confidence interval.
Write your hypothesis in the Lab Report panel, then click Next.
Controls
Each new capture draws a fresh second sample at random from the field, so the number of recaptured tags changes a little every time, just like real field work.
The field
Showing a sample of the population. The full field holds 500 animals.
Estimates
Recaptured tags (R)
20
expected near 20.0
Lincoln-Petersen
500
Nhat = M × C / R
Chapman (best estimate)
485
bias corrected
95% confidence interval
324 to 646
Chapman ± 1.96 √Var
True population
500
hidden in real studies
Estimate error
3.0%
Chapman 485 vs true 500
The two formulas
Lincoln-Petersen, Nhat = M × C / R = 100 × 100 / 20 = 500
Chapman, Nhat = (M+1)(C+1) / (R+1) − 1 = 485
This draw recaptured 20 of the 100 tagged animals in a second sample of 100. The Chapman estimate of 485 is off the true 500 by about 3%. More recaptures give a narrower confidence interval.
Data Table
(0 rows)| # | True N | First capture (M) | Second capture (C) | Recaptured (R) | Lincoln-Petersen | Chapman | 95% CI width |
|---|
Reference Guide
How the Method Works
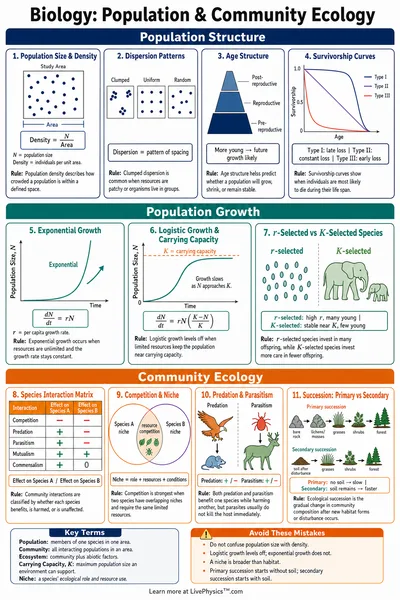
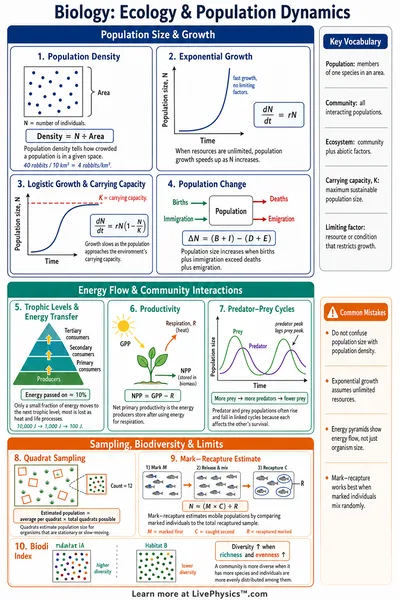
Mark-recapture lets ecologists estimate a population they could never count one by one. The idea is simple. Catch a group, mark it, let it mix back in, then catch a second group and see what fraction already carries a mark.
- M is the number tagged and released in the first capture.
- C is the number caught in the second capture.
- R is how many of the second capture already carry a tag.
If tagged animals mix evenly, the fraction tagged in the second sample should match the fraction tagged in the whole population.
The Two Estimators
The Lincoln-Petersen estimator is the classic version. The Chapman estimator adds a small correction that removes bias and stays defined even when no tags come back.
Lincoln-Petersen, Nhat = M × C / R
Chapman, Nhat = (M+1)(C+1) / (R+1) − 1
When R is small the Lincoln-Petersen estimate can swing wildly, and it fails entirely at R equal to zero. The Chapman estimator is the safer choice for real field data.
The Assumptions Behind It
The estimate is only as good as the assumptions. Break one of these and the population size can be badly over or under counted.
- Closed population. No births, deaths, arrivals, or departures between captures.
- No tag loss. Marks stay on and stay readable.
- Equal catchability. Every animal is equally likely to be caught.
- Random mixing. Tagged animals spread back through the whole population.
Run a new capture a few times to see how much the estimate jumps around from one random sample to the next.
Where It Is Used
Mark-recapture is a workhorse of fisheries and wildlife biology. The same math also turns up in epidemiology and software testing, anywhere you need to count something you cannot fully observe.
- Fisheries. Tagging fish to estimate stock size in a lake or river.
- Wildlife. Counting deer, butterflies, lizards, and birds.
- Public health. Estimating hidden case counts from two record sources.
Bigger samples bring back more tags, and more tags give a narrower confidence interval, so precision costs field effort.