Survey Bias Lab
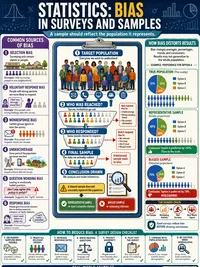
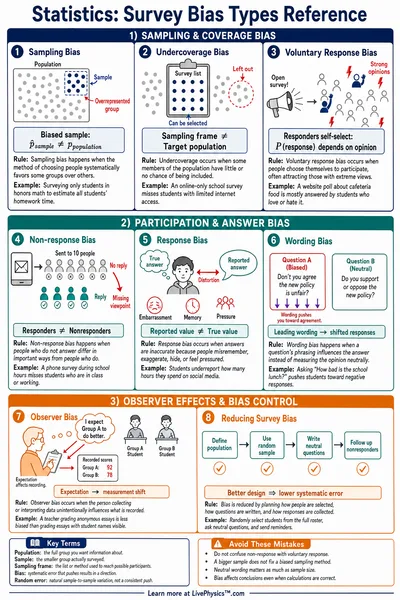
Read a survey scenario, the question wording, the sampling method, and who responded, then identify the bias at work. Practice spotting leading questions, loaded wording, non-response bias, convenience samples, social desirability, undercoverage, and question order effects.
Guided Experiment Spot the Bias, Then Fix It
Hypothesis
Setup
Run Experiment
Analyze
Conclude
Read the setup. Which type of bias do you predict is at work, and why?
Write your hypothesis in the Lab Report panel, then click Next.
Controls
The School Lunch Survey
A survey asked: 'Do you agree that our amazing new lunch menu is a big improvement?' Students answered on a paper form handed out in the cafeteria line.
What kind of bias is this?
0 / 500
0 / 500
0 / 500
Reference Guide
Types of Survey Bias
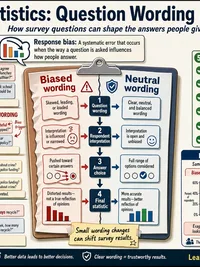
- Leading question. The wording hints at the answer the surveyor expects, such as asking "Don't you agree that...?"
- Loaded wording. Emotionally charged words frame a topic before the reader can judge it fairly.
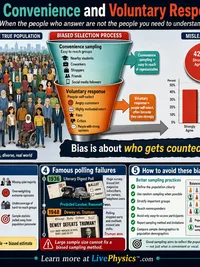
- Non-response bias. The people who choose to answer an optional survey are not representative of everyone asked.
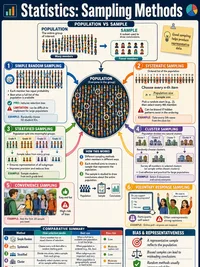
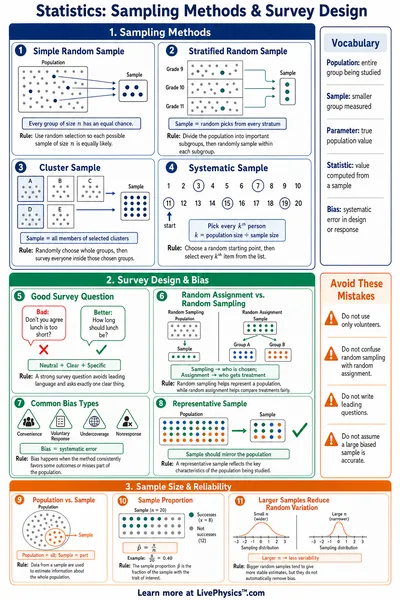
- Convenience sample. Respondents are chosen because they are easy to reach, not because they represent the full population.
- Social desirability bias. People give the answer that looks good to others rather than the honest answer.
- Undercoverage. The sampling method leaves out part of the population entirely, such as households without a landline.
- Question order bias. An earlier question changes how people answer a later one.
How to Use This Lab
- Pick a scenario and a difficulty level.
- Read the survey question, the method, and who responded closely.
- Choose the bias type you think is at work.
- In Challenge mode, also choose a fix that would remove the bias.
- Reveal the explanation and the de-biased version, then record your notes in the lab report below.
Related Content
Related Tools
Sampling Distribution Visualizer
Pick a population distribution and watch the Central Limit Theorem in action. Draw random samples, plot the means, and see how the sampling distribution becomes normal regardless of population shape.
Central Limit Theorem Simulator
Draw repeated samples from non-normal populations and watch the sampling distribution become normal. Side-by-side histograms.
Power & Sample Size Planner
Plan a study by balancing effect size, sample size, significance level, and power. See the null and alternative distributions, the Type I and Type II error regions, and the power curve, then read the sample size you need.
Simpson's Paradox Explorer
See how a trend that holds inside every group can reverse when the groups are combined. Adjust the group slopes and separation, then toggle between the split and pooled views to watch Simpson's paradox appear.
Related Labs
Scientific Data Graphing Lab
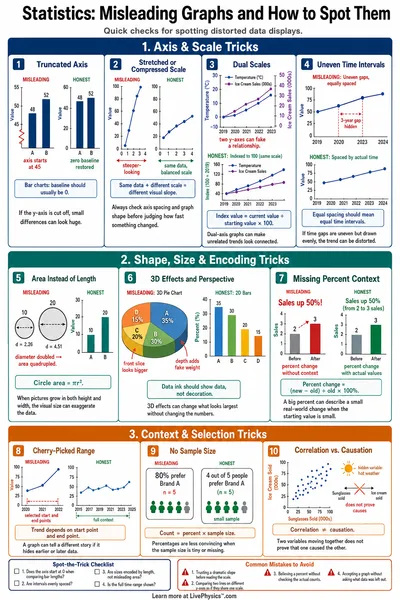
General purpose data analysis lab. Paste a CSV, upload a file, or load a sample. Choose X and Y columns and fit a linear, quadratic, cubic, power, exponential, or logarithmic curve. Auto best fit picker, R squared, residuals, and shareable URL.
Graphs for Kids Lab
Build bar graphs from category data, read which groups have the most and fewest, compute the difference, and record findings to practice data literacy skills.
Mean, Median & Mode Lab
Enter number datasets, compute mean, median, mode, and range instantly, and record multiple datasets to discover when each measure of center best represents the data.
Hypothesis Testing Lab
Set up a one-sample z-test. Enter population mean, sample mean, standard deviation, and sample size. Compute the z-statistic, p-value, and decision to reject or fail to reject the null hypothesis.