Statistics
Ignoring How Outliers Affect the Mean
Students treat the mean as a typical value even when one outlier pulls it far away from most of the data.
Quick check
Why students make it
Students often think the mean always describes the center of a data set. They forget that every value is included in the sum, so one very large or very small value can move the mean a lot.
The rule done right
The mean is , so outliers affect it. When a data set has an outlier, compare the mean with the median before saying what is typical.
Related resources
-
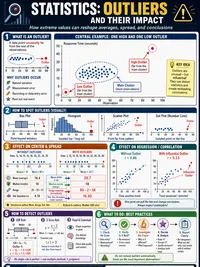 Outliers and Their Impact Infographic
-
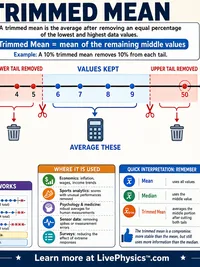 The Trimmed Mean Infographic
-
 Mean vs Median Infographic
-
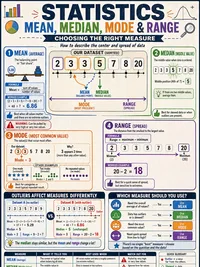 Mean, Median & Mode Infographic
-
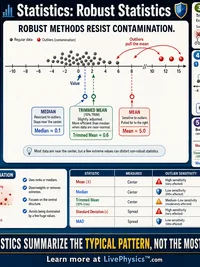 Robust Statistics Infographic
- How to tell mode and median apart Memory Aid Cheat Sheet
- Mean, Median, Mode & Range Cheat Sheet
- Descriptive Statistics Cheat Sheet
- Five-Number Summary & Box Plot Reference Cheat Sheet
- Quartiles, Percentiles & IQR Cheat Sheet
- Statistics, How to Tell Mode and Median Apart Practice Worksheet
- Statistics, Finding the Mean Median and Mode Worksheet
- Statistics, Measures of Center and Spread Worksheet
- Statistics, Range and Outliers Worksheet
- Statistics, Descriptive Statistics (High School) Worksheet
- Mean, Median & Mode Explorer Tool
- Descriptive Statistics Calculator Tool
- Box Plot Builder Tool
- Percentile Calculator Tool
- Mean, Median & Mode Lab Lab
- Exploratory Data & Distribution Lab Lab
- Regression & Residual Diagnostics Lab Lab
Continue learning
- Mixing Up Mean and MedianCommon mistake
- Middle School Statistics VocabularyFlashcards
- Statistics, Confidence Interval for a MeanStudy poster
- Statistics, Mean Absolute DeviationStudy poster
- Ignoring Sample Size When Comparing PercentagesCommon mistake
- Mean Median Mode and Range from Frequency TablesCheat sheet