ECG & Heart Rhythm Explorer
Choose a heart rhythm or set the heart rate and conduction intervals yourself. The tool synthesizes an electrocardiogram on the classic pink clinical grid, labels the P wave, QRS complex, and T wave, measures the RR, PR, QRS, QT, and QTc intervals, and classifies the rhythm. Built for high school biology, anatomy and physiology, and introductory college courses.
This is a learning tool that draws an illustrative trace. It is not a diagnostic device and not medical advice.
Each beat starts in the SA node, a clear P wave precedes every narrow QRS, and the rhythm is regular at a normal rate.
Adjusting the heart rate or intervals keeps the selected rhythm waveform but recomputes the strip and the classification. Pick a preset to reset to clinically typical values.
ECG strip (lead II)
72 bpmThe red dots mark detected R peaks. The teal dashed lines flag a representative P wave and T wave around one QRS complex. In atrial fibrillation the P waves are replaced by a wavy fibrillatory baseline, and in ventricular tachycardia the wide QRS complexes have no preceding P waves.
Measurements and interpretation
NormalEach beat starts in the SA node, a clear P wave precedes every narrow QRS, and the rhythm is regular at a normal rate.
- The QRS complex is the tall spike where the ventricles contract.
- A PR interval longer than 200 ms signals a first-degree AV block.
- Atrial fibrillation has no clear P waves and an irregular rhythm.
QTc uses the Bazett correction, QTc = QT / sqrt(RR in seconds). It adjusts the raw QT for heart rate so values are comparable across different rates.
Reference Guide
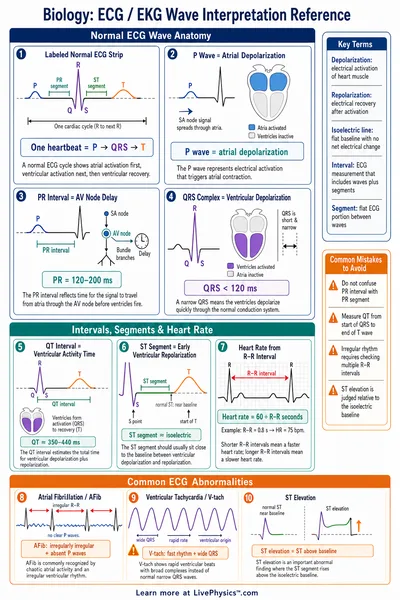
The parts of an ECG
Each heartbeat draws a repeating shape made of three main parts.
- The P wave is a small bump as the atria depolarize and contract.
- The QRS complex is the tall spike as the ventricles depolarize and contract.
- The T wave is a rounded bump as the ventricles recover and reset.
The QRS is the largest deflection because the ventricles have the most muscle. Reading these parts in order tells you how the electrical signal moved through the heart.
The intervals and what they mean
The horizontal distances between parts of the trace are measured in milliseconds.
- RR is the time between beats and sets the heart rate (rate = 60000 / RR).
- PR is from the start of the P wave to the QRS and reflects AV-node delay.
- QRS duration is the width of the spike. A wide QRS suggests an abnormal path.
- QT spans depolarization through recovery. QTc corrects QT for the heart rate.
QTc uses the Bazett correction so values at fast and slow rates can be compared on the same scale.
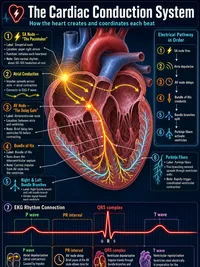
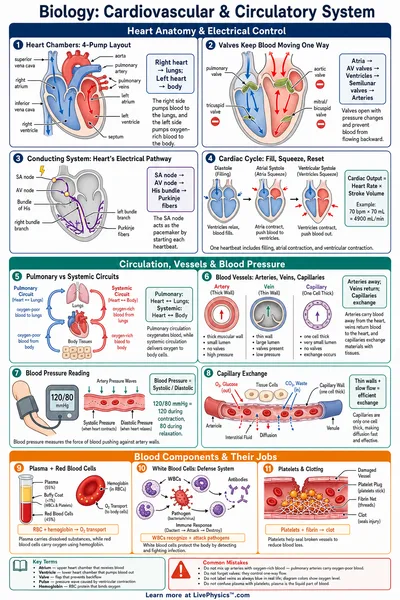
The cardiac conduction system
The waveform follows the path of the electrical signal through the heart.
- The SA node in the right atrium fires first and sets the pace. Its signal makes the P wave.
- The AV node delays the signal so the atria can finish filling the ventricles. This delay is the PR interval.
- The His-Purkinje fibers spread the signal fast through the ventricles, producing the narrow QRS.
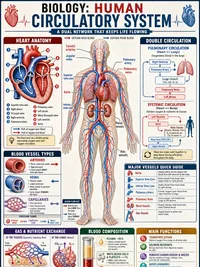
Blood flow through the chambers is covered in the related Circulatory System Flow Lab. This tool focuses on the electrical waveform instead.
Common rhythms
Comparing the trace, the rate, and the intervals lets you sort rhythms into named patterns.
- Normal sinus rhythm has a clear P before every narrow QRS at 60 to 100 bpm.
- Bradycardia is slower than 60 bpm and tachycardia is faster than 100 bpm.
- First-degree AV block keeps a normal pattern but stretches the PR beyond 200 ms.
- Atrial fibrillation loses the P waves and the beats fall at irregular times.
- Ventricular tachycardia is fast with wide QRS complexes and no P waves.