Groundwater & Aquifer Explorer
Look beneath the surface at how groundwater really works. Slide the rainfall recharge and well pumping rate up and down to see the water table move, watch a cone of depression form around the well, and discover the point where a well runs dry.
Controls
Scenarios
Well Status
Well is flowing
The water table is above the well bottom, so the well can pump water.
- Water table depth
- 15.6 m
- Depth at the well
- 17.7 m
- Water column in well
- 10.3 m
- Cone radius
- 18.2 m
Recharge outpaces pumping. The water table is rising and the aquifer is refilling.
Groundwater Terms
- Water table
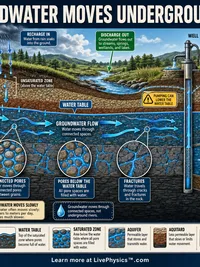
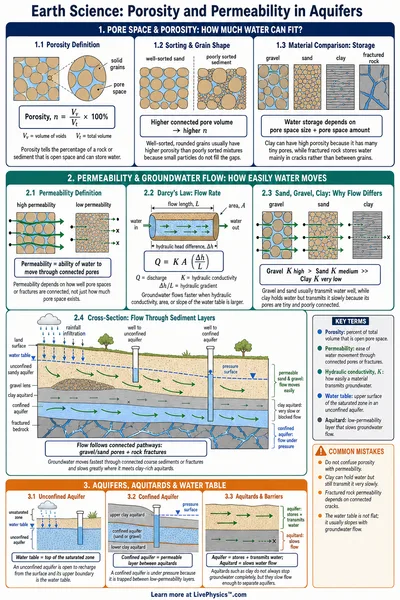
- The top of the saturated zone, where all the pore spaces in the ground are filled with water. It rises with recharge and falls with pumping or drought.
- Unsaturated (vadose) zone
- The ground above the water table. Its pores hold both air and water. Rain soaks down through this zone before reaching the water table.
- Saturated zone
- The ground below the water table, where every pore is completely filled with water. Wells draw water from here.
- Aquifer
- A body of rock or sediment that holds and transmits enough groundwater to supply wells and springs.
- Unconfined aquifer
- An aquifer whose upper boundary is the water table itself, open to recharge from the surface above it.
- Confined aquifer
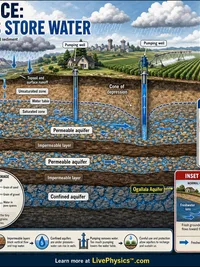
- An aquifer trapped between two aquitards. It is under pressure, so water in a well may rise above the top of the aquifer.
- Aquitard
- A layer of low permeability, such as clay, that slows the movement of water and can separate or confine aquifers.
- Porosity
- The fraction of a rock or soil made up of open pore space. High porosity means the material can store a lot of water.
- Permeability
- How easily water moves through a material. Sand and gravel are permeable, while clay is not, even though clay can be quite porous.
- Recharge
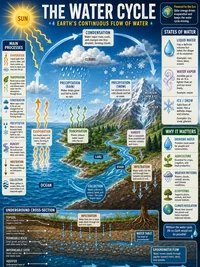
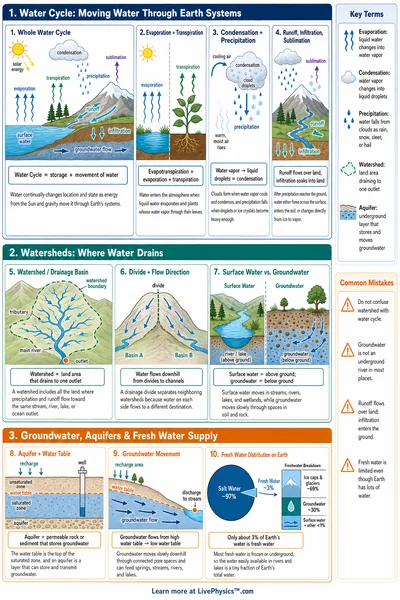
- Water that soaks down from rain, snowmelt, or surface water and adds to the saturated zone, raising the water table.
- Discharge
- Groundwater leaving the aquifer through springs, streams, wetlands, or pumping wells.
- Cone of depression
- The funnel-shaped dip in the water table around a pumping well. Faster pumping makes a deeper, wider cone.
Concept Check
Reference Guide
Zones underground
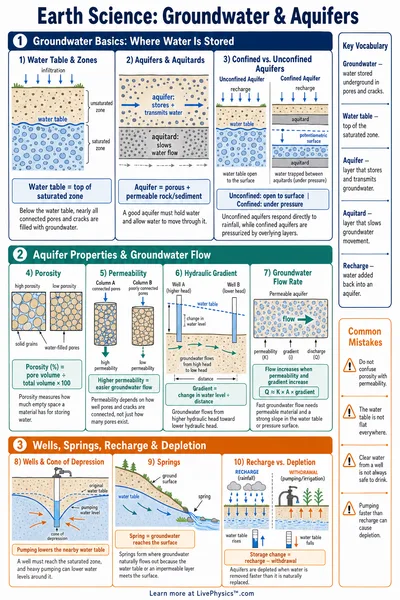
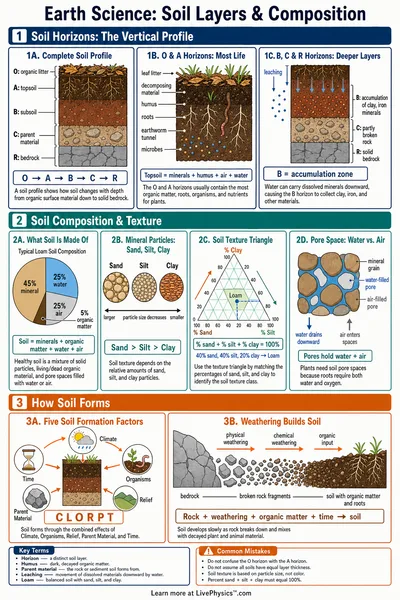
Below the surface the ground is split into two zones. In the unsaturated zone, also called the vadose zone, the pore spaces hold both air and water. Below it, in the saturated zone, every pore is completely filled with water.
The boundary between them is the water table. Wells must reach below the water table, into the saturated zone, to bring up water.
Aquifers and aquitards
An aquifer is a layer of rock or sediment that stores and moves enough water to supply wells and springs. An unconfined aquifer is open to the surface, so its top is the water table itself.
A confined aquifer is trapped between aquitards, low-permeability layers such as clay. Confined water is under pressure, so it can rise in a well above the top of the aquifer.
Recharge and discharge
Recharge is water that soaks down from rain, snowmelt, and surface water and adds to the saturated zone. When recharge is high, the water table rises.
Discharge is water leaving the aquifer through springs, streams, wetlands, and pumping wells. When discharge outpaces recharge for a long time, the water table falls and wells can struggle to keep up.
Porosity, permeability, and the cone of depression
Porosity is how much open pore space a material has, so it sets how much water the ground can store. Permeability is how easily water flows through it. Sand and gravel are permeable, while clay is porous but barely permeable.
When a well pumps, it draws the nearby water table down into a funnel shape called a cone of depression. Faster pumping makes a deeper, wider cone. If the cone pulls the water table below the well bottom, the well runs dry.