Sign in to save

Bookmark this page so you can find it later.

Sign in to save

Bookmark this page so you can find it later.

Soil Erosion Explorer

Calculate soil erosion rates using the Universal Soil Loss Equation (USLE). Adjust rainfall intensity, soil texture, slope geometry, and land cover to estimate annual soil loss. Compare erosion across land uses and evaluate the effectiveness of conservation practices like terracing, contour farming, and cover crops.

Hillslope Cross-Section

Slope: 9%Cover: CroplandErosion: 512.8 t/ha/yr

Controls

mm
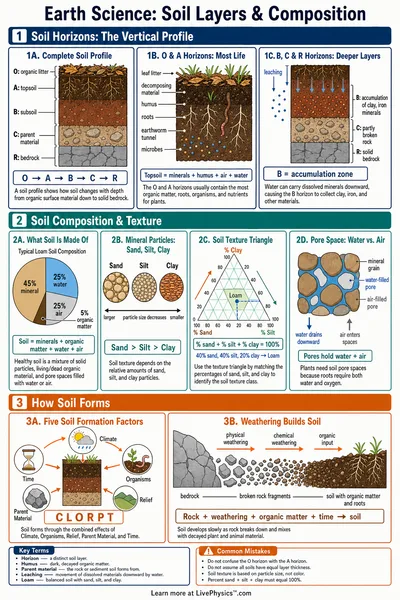
Soil Texture (must sum to 100%)
%
%
%
%
m
%

USLE Results

A=R×K×LS×C×P=512.81 t/ha/yrA = R \times K \times LS \times C \times P = 512.81 \text{ t/ha/yr}
R Factor
2279.93
K Factor
0.350
LS Factor
1.83
C Factor
0.350
P Factor
1.000
Sediment Yield
153.84
Erosion Risk Level
Severe
512.81 t/ha/yr

Erosion vs Slope Steepness

Reference Guide

Universal Soil Loss Equation

The USLE predicts long-term average annual soil loss from sheet and rill erosion. Developed by Wischmeier and Smith (1978).

A=R×K×LS×C×PA = R \times K \times LS \times C \times P

Where AA is the estimated soil loss in tons/hectare/year, and each factor captures a different driver of erosion.

R, K, and LS Factors

R (Rainfall Erosivity) measures the erosive force of rainfall. Higher rainfall with greater intensity produces more erosion. Approximated as R0.0483×P1.61R \approx 0.0483 \times P^{1.61}.

K (Soil Erodibility) reflects how easily soil particles detach. Silty soils (K up to 0.7) erode far more than sandy soils. Organic matter reduces erodibility.

LS (Slope Length-Steepness) captures the topographic effect. Steeper, longer slopes accelerate runoff and increase erosion exponentially.

Cover Factor (C)

The C factor measures the protective effect of vegetation and ground cover on erosion. It ranges from 0 to 1.

Land Cover C Factor
Bare Soil 1.000
Cropland (conventional) 0.350
Grassland / Pasture 0.010
Urban / Paved 0.010
Forest 0.003

Dense vegetation intercepts raindrops, slows runoff, and holds soil with root systems. Forests reduce erosion by over 99% compared to bare soil.

Conservation Practice Factor (P)

The P factor reflects the effect of support practices that reduce erosion. A value of 1.0 means no conservation; lower values indicate greater protection.

Practice P Factor
None 1.00
Contour Farming 0.50
Buffer Strips 0.35
No-Till Farming 0.25
Cover Crops 0.25
Terracing 0.10

When multiple practices are combined, their P factors multiply together. For example, contour farming (0.50) with terracing (0.10) gives P = 0.05, a 95% reduction.
Related Content

Related Tools

Earthquake Magnitude Calculator
Four modes: magnitude scales (Richter Mₗ, moment magnitude M𝑤, energy), energy comparison (each step = 31.6× more energy, logarithmic bar chart), Modified Mercalli Intensity I-XII with descriptions, and Richter magnitude from seismograph amplitude. Presets include Minor M3 through Great M8, 1906 San Francisco M7.9, and 2011 Japan M9.1.
Carbon Footprint Calculator
Estimate annual CO₂ emissions from transportation (car miles, fuel type, flights), home energy (electricity, heating, AC), diet (meat consumption, food waste), and lifestyle (shopping, recycling). Pie chart breakdown, country comparison bar chart, trees-to-offset and equivalent-driving metrics. Five presets: Average American, Eco-Conscious, Heavy Commuter, Frequent Flyer, Work from Home.
Star Lifecycle Visualizer
Three modes: interactive HR diagram with 23 real stars (click to see properties), stellar evolution pathway from nebula to end state (white dwarf, neutron star, or black hole based on initial mass), and star properties calculator (luminosity L∝M^3.5, radius, lifetime t∝M^-2.5, apparent magnitude). Six presets: Sun, Red Dwarf (0.3 M☉), Sirius A (2 M☉), Blue Giant (20 M☉), Betelgeuse (15 M☉), Supergiant (50 M☉). Includes spectral class colour strip and SVG star visualization.
H-R Diagram Explorer
Three modes: plot a single star on the Hertzsprung-Russell diagram from temperature, radius, and mass (Stefan-Boltzmann luminosity, spectral class O-M, absolute magnitude, HR region); compare multiple stars side by side; and browse the spectral atlas with typical properties for each class. 23 reference stars plotted, 6 presets from Proxima Centauri to Rigel.