Practice identifying buffer systems, using the Henderson-Hasselbalch equation, and interpreting titration curves for strong and weak acids and bases.
Read each problem carefully. Show your setup, units, and reasoning for calculation problems. Use pH = pKa + log([base]/[acid]) when appropriate.
Using buffer equations and interpreting acid-base titration graphs
Chemistry - Grade 9-12
- 1
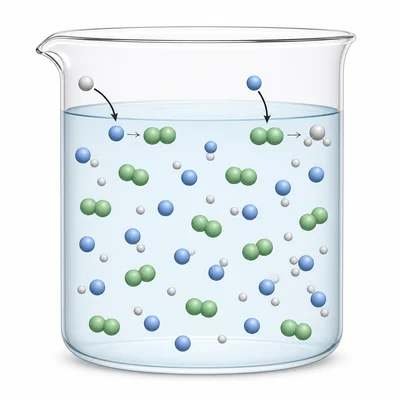
A solution contains 0.20 M HF and 0.25 M NaF. Explain why this solution acts as a buffer.
- 2
A buffer contains 0.10 M acetic acid, HC2H3O2, and 0.25 M acetate ion, C2H3O2-. The pKa of acetic acid is 4.76. Calculate the pH of the buffer.
- 3
A buffer is made with 0.200 mol NH3 and 0.300 mol NH4+ in 1.00 L of solution. The pKa of NH4+ is 9.25. What is the pH after 0.050 mol HCl is added? Assume the volume change is negligible.
- 4
A student says, "A buffer keeps pH from ever changing." Correct this statement using accurate chemistry language.
- 5
A 25.0 mL sample of 0.100 M HCl is titrated with 0.125 M NaOH. Calculate the volume of NaOH needed to reach the equivalence point.
- 6
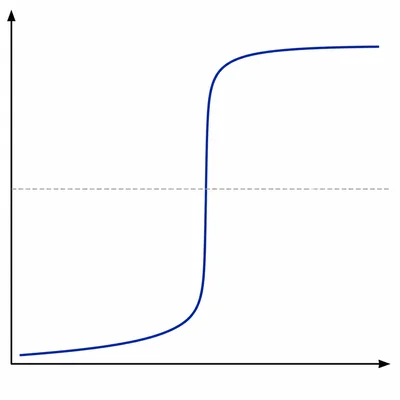
A titration curve starts at pH 1.0, rises slowly, has a very steep vertical region centered at pH 7.0, and levels off above pH 12. What type of titration does this curve most likely show?
- 7
For a weak acid titrated with a strong base, the pH at the half-equivalence point is 4.74. What is the pKa of the acid, and what is its Ka?
- 8
A weak acid is titrated with NaOH. The equivalence point occurs at 32.0 mL of NaOH added. At what volume of NaOH added does the half-equivalence point occur? Explain what is special about that point.
- 9

Which indicator is more appropriate for a weak acid titrated with a strong base: methyl orange, which changes color around pH 3.1 to 4.4, or phenolphthalein, which changes color around pH 8.2 to 10.0? Explain your choice.
- 10
A 50.0 mL sample of 0.100 M acetic acid is titrated with 0.100 M NaOH. What volume of NaOH is needed to reach the equivalence point?
- 11
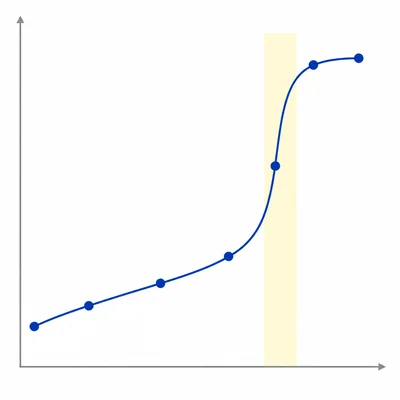
The following titration data were collected for a weak acid titrated with 0.100 M NaOH: 0.0 mL, pH 2.9; 10.0 mL, pH 4.2; 20.0 mL, pH 4.8; 30.0 mL, pH 5.3; 40.0 mL, pH 8.7; 41.0 mL, pH 10.5; 50.0 mL, pH 11.5. Estimate the equivalence point volume and explain your reasoning.
- 12
A buffer contains equal concentrations of H2CO3 and HCO3-. The pKa for H2CO3 is 6.35. What is the pH of the buffer? Explain without doing a long calculation.
- 13
A buffer is prepared using 0.40 M lactic acid and 0.04 M lactate ion. The pKa of lactic acid is 3.86. Is the pH higher than, lower than, or equal to 3.86? Explain.
- 14
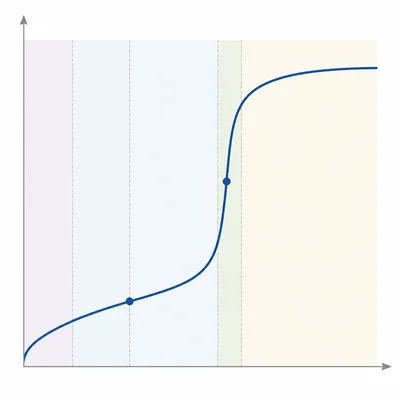
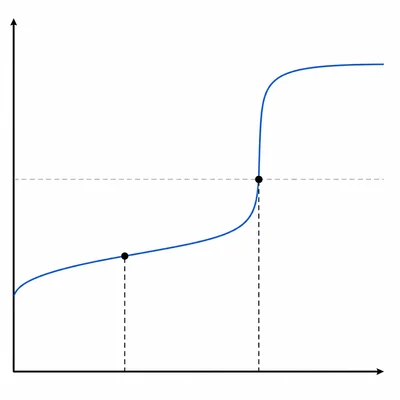
Label the main regions on a weak acid strong base titration curve: initial weak acid region, buffer region, half-equivalence point, equivalence point, and excess base region. Describe what happens chemically in the buffer region.
- 15
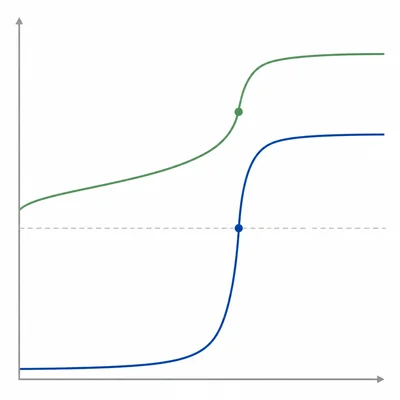
Compare the equivalence point pH for these two titrations: 0.100 M HCl titrated with 0.100 M NaOH, and 0.100 M CH3COOH titrated with 0.100 M NaOH.