Understanding Titration Lab
Titration is a mole-counting method disguised as a color experiment. The central idea is that acid particles and base particles react in fixed number ratios, so a measured volume can reveal an unknown concentration.
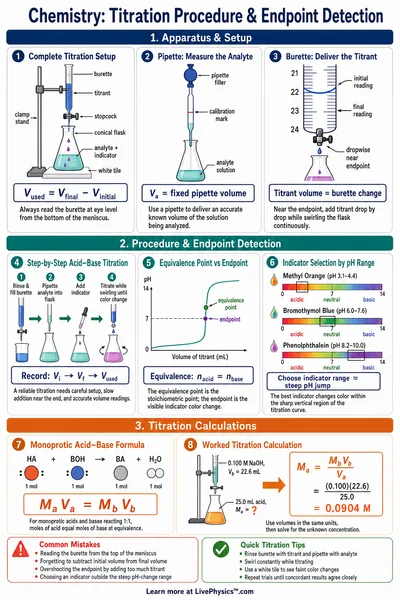
The burette matters because it delivers liquid in small, readable amounts. Students should record the starting and ending burette readings, then subtract them, rather than assuming the reading begins at zero.
Before calculations, convert each solution volume into litres and use concentration times volume to find moles. For a simple one-to-one reaction, the moles of acid at equivalence equal the moles of base added.
Some reactions do not use a one-to-one ratio. For example, one particle of a substance may react with two hydroxide particles, so the balanced chemical equation must guide every calculation.
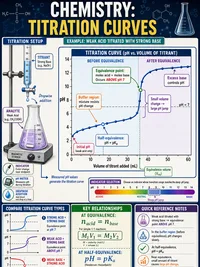
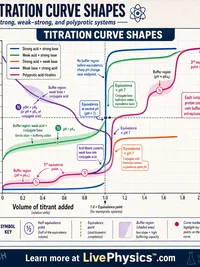
The steep part of a pH curve happens because the acid has nearly all been used up. Near this region, one extra drop can cause a large pH change, which is why careful dropwise addition is essential.
Equivalence point and endpoint are related but not identical. Equivalence is the exact reaction balance predicted by chemistry, while the endpoint is the visible indicator change used to estimate that balance.
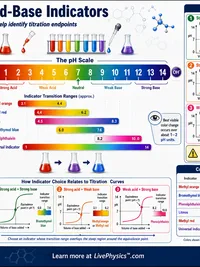
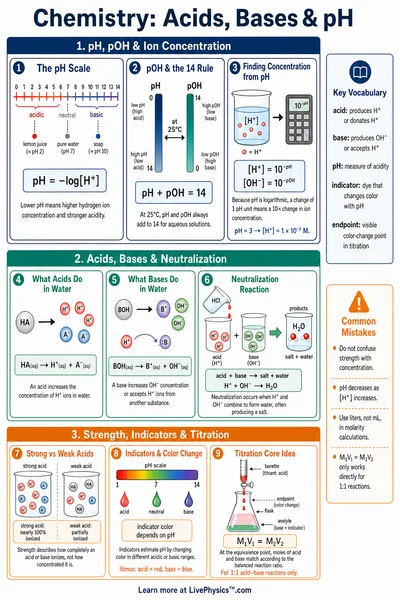
An indicator works because its molecules have different colors in different acid conditions. A useful indicator changes color within the sharp pH jump, not far before or after it.
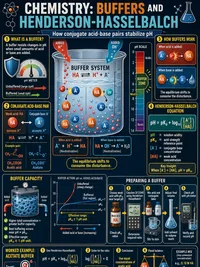
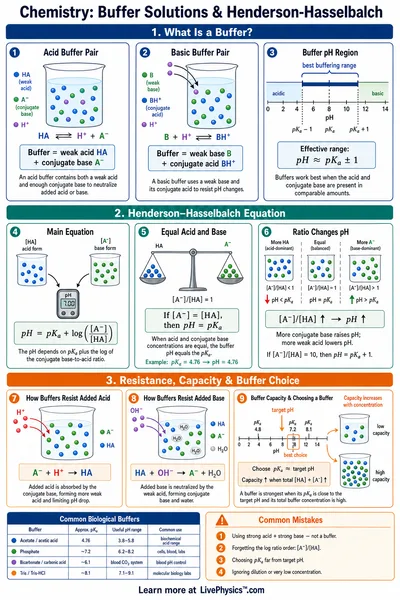
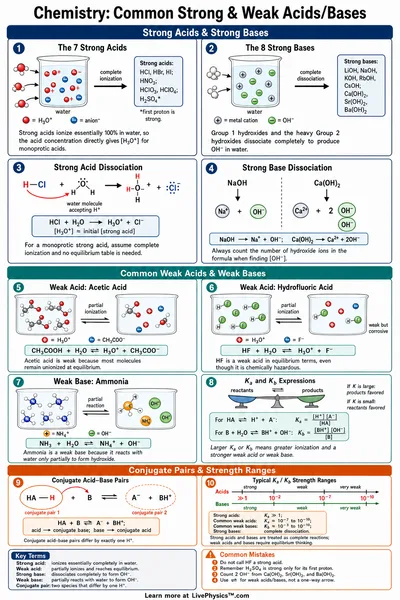
Weak acids behave differently because they only partly form hydrogen ions in water. As base is added, a mixture of weak acid and its reacted form can resist pH change for a while, creating a buffer region.
At the halfway point of a weak acid titration, equal amounts of weak acid and its reacted form are present. The pH at this point gives useful information about the acid's strength, even before the reaction reaches equivalence.
Real titrations contain small sources of error. Air bubbles in the burette tip, drops left on flask walls, overshooting the color change, and misreading the liquid level can all change the calculated concentration.
A white tile placed under the flask makes a faint indicator change easier to see in a physical lab. Swirling after each addition spreads the incoming base through the whole solution and prevents a temporary local color change from misleading the observer.
When studying a graph, focus on volume as well as pH. The curve shows how chemical amounts control acidity, while the calculation checks whether the observed endpoint gives a sensible concentration.