Analyze wind turbine blade pitch data to identify patterns, compare results, and make evidence-based engineering decisions.
Read each problem carefully. Use the data provided to answer the questions. Show your work and explain your reasoning.
Using data to choose efficient wind turbine blade angles
Engineering - Grade 6-8
- 1
A student team tested a model wind turbine at four blade pitch angles. The electrical output was measured in volts. Data: 0 degrees = 1.2 V, 10 degrees = 2.4 V, 20 degrees = 3.1 V, 30 degrees = 2.0 V. Which blade pitch produced the highest voltage?
- 2
Using the same data, describe the pattern in voltage as the blade pitch changes from 0 degrees to 30 degrees.
- 3
A turbine produces 2.8 V at a 15 degree pitch and 3.4 V at a 25 degree pitch. How much did the voltage increase?
- 4
A team ran three trials at a 20 degree blade pitch. The voltage readings were 3.0 V, 3.2 V, and 3.1 V. Find the mean voltage.
- 5
A team ran three trials at a 30 degree blade pitch. The voltage readings were 2.1 V, 2.0 V, and 2.2 V. Find the mean voltage.
- 6
Compare the mean outputs from a 20 degree pitch and a 30 degree pitch. The 20 degree pitch mean was 3.1 V. The 30 degree pitch mean was 2.1 V. Which pitch performed better, and by how much?
- 7
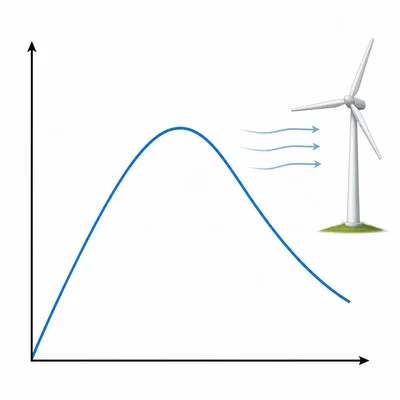
A graph shows voltage output on the y-axis and blade pitch angle on the x-axis. The graph rises until 20 degrees and then falls after 20 degrees. What engineering conclusion can you make from this graph?
- 8
A wind turbine test used these average outputs: 5 degrees = 1.8 V, 15 degrees = 2.9 V, 25 degrees = 3.0 V, 35 degrees = 1.9 V. Which two pitch angles had nearly the same output?
- 9
A team wants to choose between 15 degrees and 25 degrees. The 15 degree pitch produced 2.9 V, and the 25 degree pitch produced 3.0 V. If the 15 degree pitch is easier to build accurately, which pitch might be the better engineering choice? Explain.
- 10
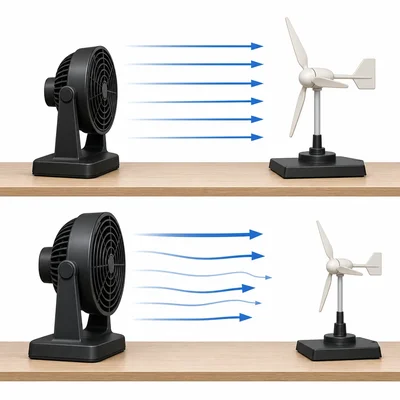
In one test, the wind speed was not kept the same for every pitch angle. Why is this a problem when analyzing blade pitch data?
- 11
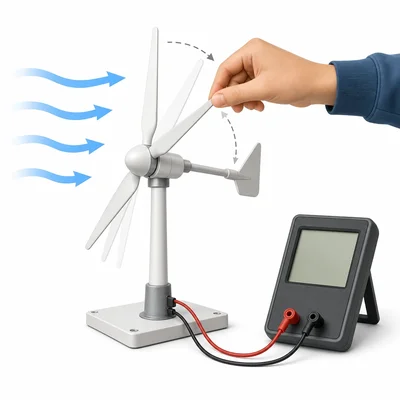
Identify the independent variable and dependent variable in this experiment: Students change the blade pitch angle and measure the voltage output.
- 12
A data table lists these results: 0 degrees = 0.9 V, 10 degrees = 1.7 V, 20 degrees = 2.6 V, 30 degrees = 2.4 V, 40 degrees = 1.5 V. Which pitch angle would you recommend for this turbine, and what evidence supports your choice?
- 13
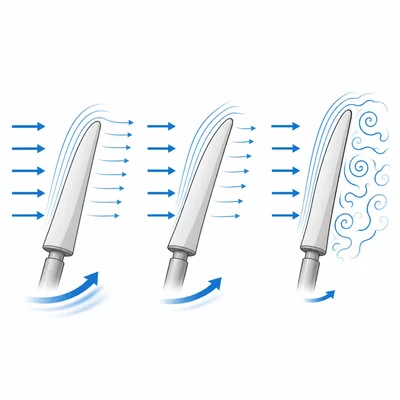
A team thinks a 45 degree pitch will always produce more power because the blades face the wind more directly. Their data show: 15 degrees = 3.0 V, 30 degrees = 2.5 V, 45 degrees = 1.6 V. Does the data support their claim? Explain.
- 14
A model turbine has a 20 degree blade pitch and produces 3.2 V. After adjusting the pitch to 25 degrees, it produces 3.5 V. What percent increase is this? Round to the nearest whole percent.
- 15
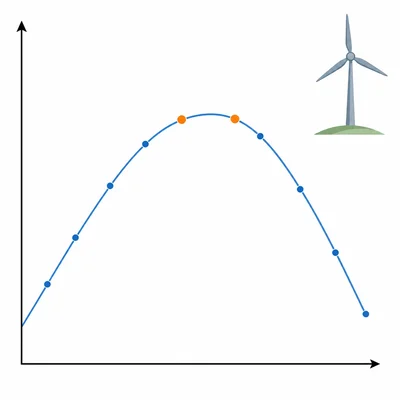
You are planning the next test after seeing this data: 10 degrees = 2.2 V, 20 degrees = 3.5 V, 30 degrees = 3.3 V, 40 degrees = 2.0 V. What two new pitch angles would you test next to find the best design more precisely? Explain your choices.