Practice collecting, organizing, and recording data in clear ways so it can be used to answer questions.
Read each problem carefully. Show your work in the space provided. Use clear labels when you make tables, tally marks, or lists.
Practice using tables, tally marks, surveys, and observations
Statistics - Grade 4-5
- 1
Mia wants to find out which fruit her classmates like best: apples, bananas, oranges, or grapes. Write one clear survey question she could ask.
- 2
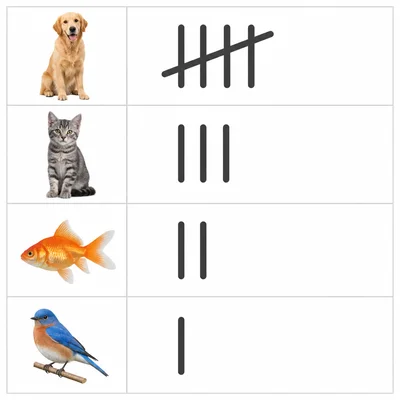
A class records favorite pets using tally marks. Dogs: |||| |, Cats: |||, Fish: ||, Birds: |. Write the number of votes for each pet.
- 3
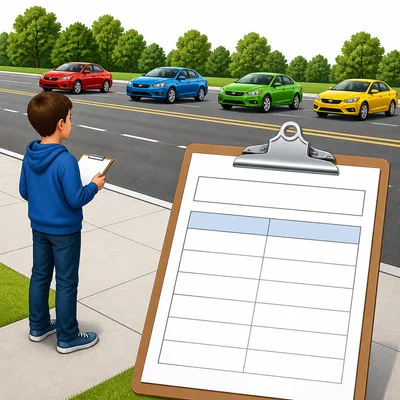
Jordan counts how many red, blue, green, and yellow cars pass by in 10 minutes. Name two things Jordan should write at the top of his data table.
- 4
The school cafeteria wants to know which lunch students prefer. Which data collection method is best: guessing, asking students in a survey, or looking at the weather? Explain your choice.
- 5
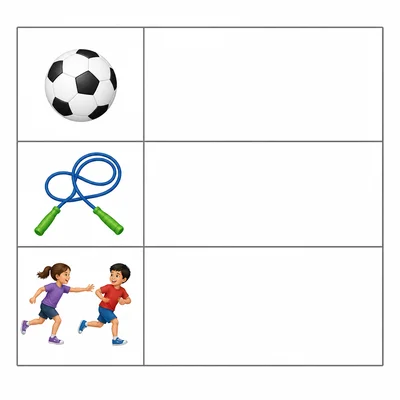
Create a tally chart for these votes for favorite recess activity: soccer, jump rope, soccer, tag, soccer, jump rope, tag, soccer.
- 6
A student writes this data in a notebook: 3, 5, 2, 4. Explain why these numbers are not very useful by themselves.
- 7
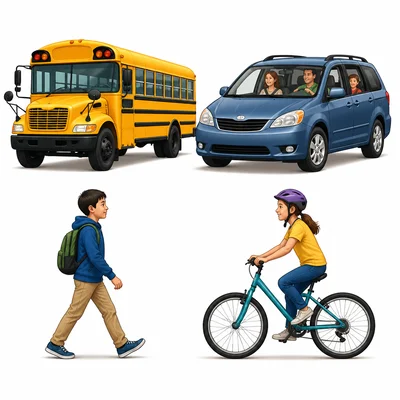
You are collecting data about how students get to school. Write four possible categories for your data table.
- 8

Look at this data table: Favorite Color, Number of Students. Red: 5, Blue: 8, Green: 4, Purple: 3. How many students were surveyed in all?
- 9
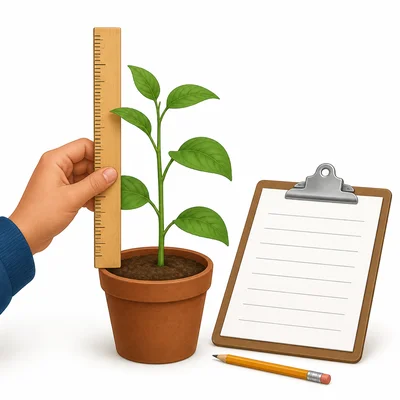
A class is measuring plant growth each Monday for four weeks. What should they record each time they measure the plant?
- 10
Sam asks only his three best friends what game the class should play. Explain why this may not give a fair picture of what the whole class wants.
- 11
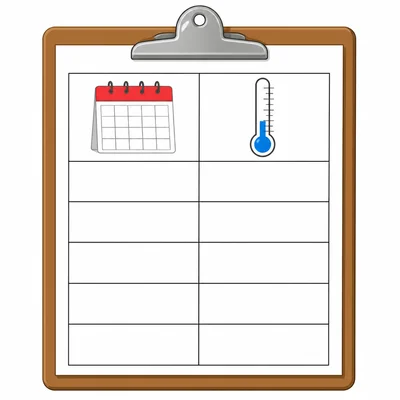
The following temperatures were recorded each day: Monday 70°F, Tuesday 72°F, Wednesday 71°F, Thursday 75°F, Friday 74°F. Make a table with two columns that would organize this data.
- 12
A teacher wants students to record how many pages they read each night for a week. Why is a table a good way to record this data?
- 13
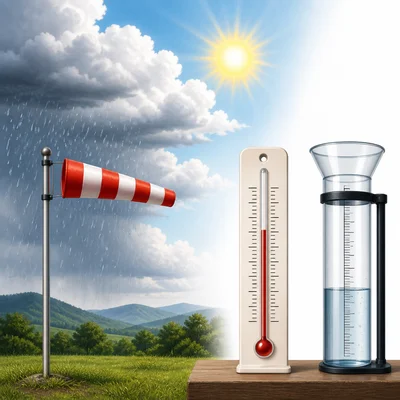
Write one observation you could record while studying the weather outside. Then write one measurement you could record.
- 14
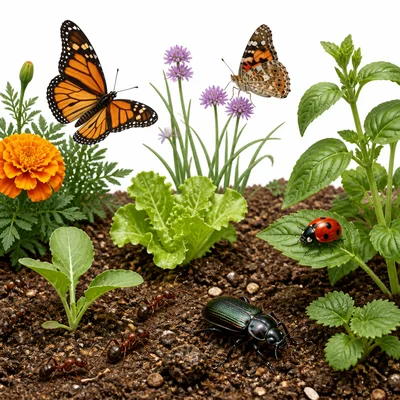
A group is counting insects in the school garden. They find 7 ants, 2 butterflies, 5 beetles, and 1 ladybug. What title would be a good title for this data table?
- 15
You finish collecting data about favorite ice cream flavors. List two things you should check before using the data to make a graph.