Correlation vs Causation Lab
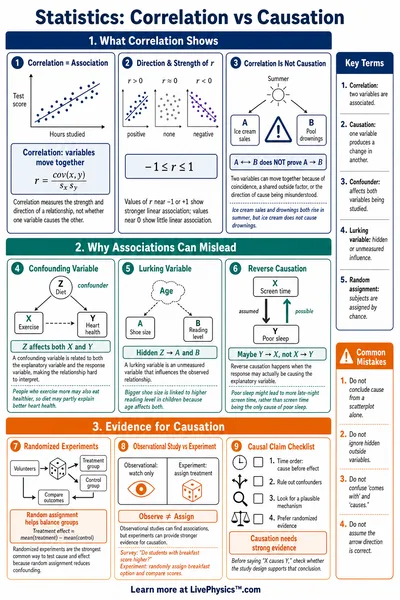
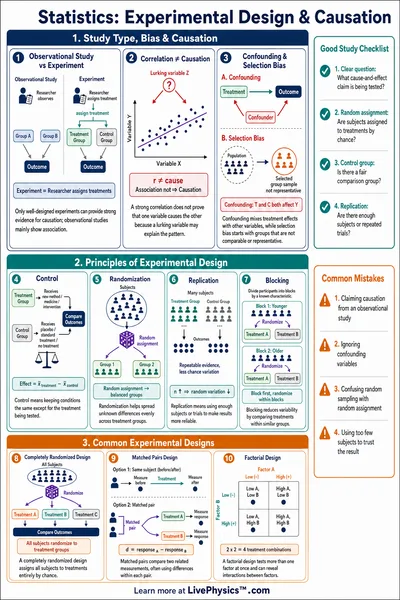
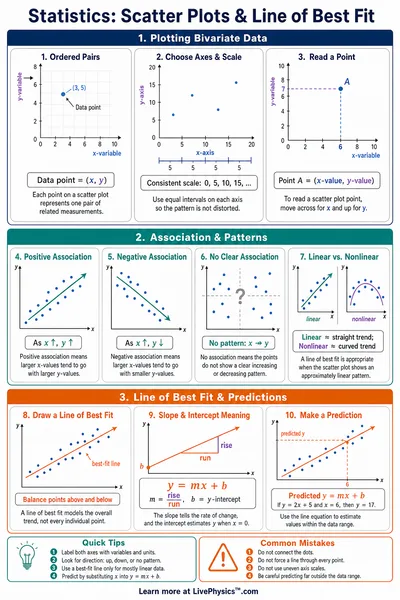
Two things can rise and fall together for very different reasons. Study a scatter plot and its correlation value, read the headline claim, and decide whether it is direct causation, reverse causation, a hidden confounding variable, or just coincidence. Then reveal what is really going on.
Guided ExperimentClassify the Relationship
Hypothesis
Setup
Run Experiment
Analyze
Conclude
Which scenario do you predict is a real cause-and-effect relationship, and which is a trick?
Write your hypothesis in the Lab Report panel, then click Next.
Controls
Ice Cream and Drowning
"Eating ice cream causes drowning."
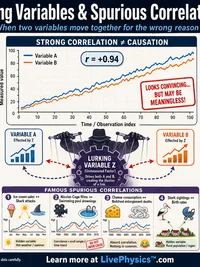
Correlation coefficient r = 1.00
What is the true relationship?
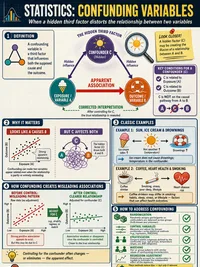
Is a third lurking variable driving both X and Y?
0 / 500
0 / 500
0 / 500
Reference Guide
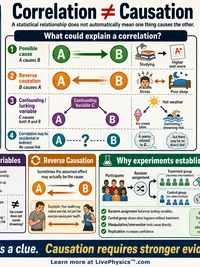
Four Ways Two Things Can Be Linked
- Direct causation. X really does make Y happen through a clear mechanism.
- Reverse causation. The arrow points the other way. Y is actually causing X.
- Confounding variable. A hidden third factor drives both X and Y at once.
- Coincidence. The two trends line up by pure chance, with no link at all.
How to Use This Lab
- Pick a scenario and a difficulty level.
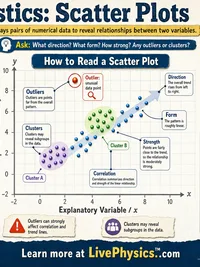
- Read the scatter plot, the correlation value r, and the headline claim.
- Classify the true relationship, then reveal the explanation.
- In Challenge mode, name the lurking variable behind confounding scenarios.
- Record what you noticed in the lab report below.
Related Content
Related Tools
Scatter Plot and Correlation Explorer
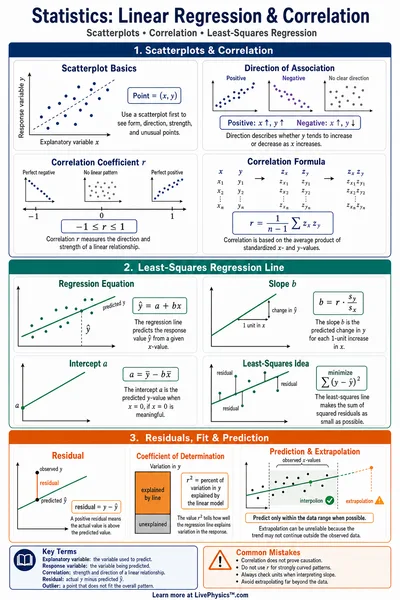
Plot x,y data pairs to visualize relationships. Computes Pearson correlation coefficient, r-squared, and fits a linear regression line.
Linear Regression Calculator
Find the best-fit line for paired data. See slope, intercept, correlation, R-squared, scatter plot, and residual analysis.
Simpson's Paradox Explorer
See how a trend that holds inside every group can reverse when the groups are combined. Adjust the group slopes and separation, then toggle between the split and pooled views to watch Simpson's paradox appear.
Linear Regression Trainer
Visualize how gradient descent finds the best-fit line on a 2D scatter dataset. Drag points, adjust slope and intercept manually with sliders, or click train to animate gradient descent for ~150 iterations. Live readouts of MSE, R-squared, and distance from the closed-form OLS optimum. Loss curve mini-plot tracks MSE over iterations. Five preset datasets including outlier-corrupted and heteroscedastic data show OLS assumptions and limits.
Related Labs
Scientific Data Graphing Lab
General purpose data analysis lab. Paste a CSV, upload a file, or load a sample. Choose X and Y columns and fit a linear, quadratic, cubic, power, exponential, or logarithmic curve. Auto best fit picker, R squared, residuals, and shareable URL.
Graphs for Kids Lab
Build bar graphs from category data, read which groups have the most and fewest, compute the difference, and record findings to practice data literacy skills.
Mean, Median & Mode Lab
Enter number datasets, compute mean, median, mode, and range instantly, and record multiple datasets to discover when each measure of center best represents the data.
Hypothesis Testing Lab
Set up a one-sample z-test. Enter population mean, sample mean, standard deviation, and sample size. Compute the z-statistic, p-value, and decision to reject or fail to reject the null hypothesis.