Climate vs Weather Sorter
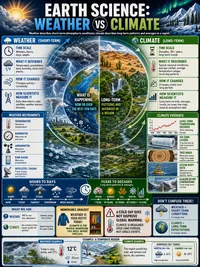
Weather is what is happening right now. Climate is the average pattern over many years. Read each statement, sort it into Weather or Climate, then see the time-scale clue that gives the answer away.
Where does this belong?
It is raining right now.
Weather and climate, side by side
Weather
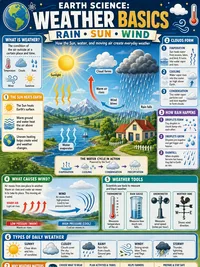
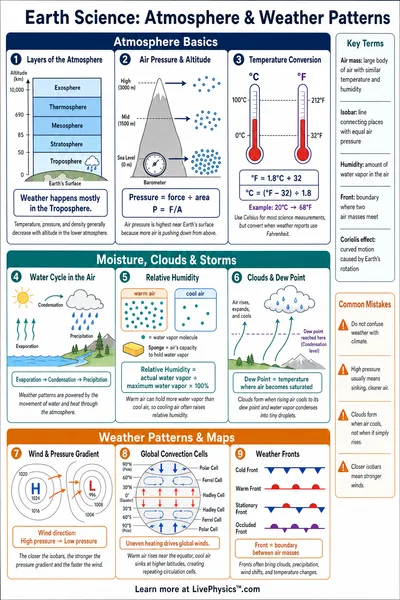
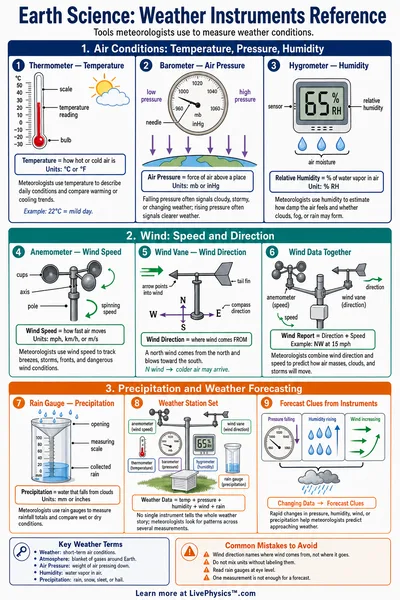
Weather is the day-to-day condition of the air in one place. It can change in hours. Rain this afternoon, a sunny morning, or a thunderstorm tonight are all weather.
Climate
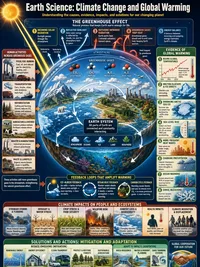
Climate is the average weather pattern for a region measured over many years, usually 30 years or more. Hot dry summers or four distinct seasons describe climate.
Quick clue. Ask how much time the statement covers. Right now, today, or tomorrow points to weather. A pattern or average over many years points to climate.
What shapes a region's climate
Latitude
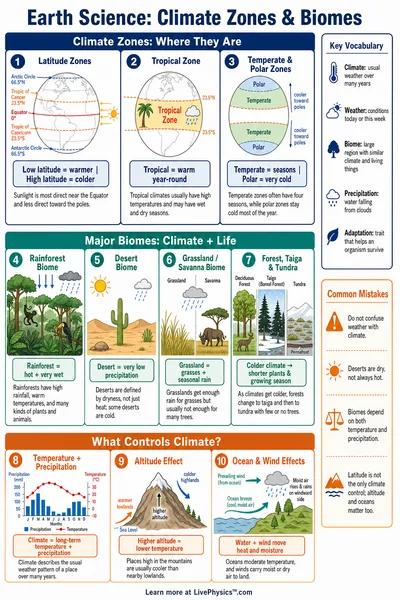
How far a place is from the equator. Areas near the equator get more direct sunlight and stay warmer all year.
Elevation
Height above sea level. Higher places, like mountains, are usually cooler than lowlands nearby.
Distance from oceans
Large bodies of water warm and cool slowly, so coastal places have milder, steadier temperatures.
Ocean currents
Warm and cold currents carry heat around the planet and change the climate of the coasts they pass.
Wind patterns
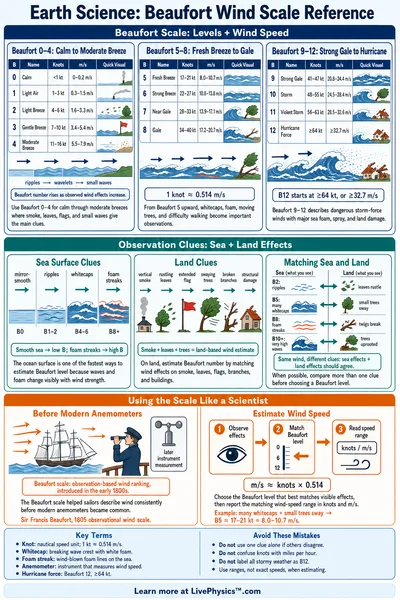
Steady winds move warm or cool, wet or dry air across regions and shape their typical weather.
Mountains
Mountains block moving air. One side can be rainy while the other side stays dry in a rain shadow.
Reference Guide
How it works
Each card shows one statement, like "It is raining right now" or "Summers here are hot and dry." Tap Weather for short-term, day-to-day conditions in one place. Tap Climate for the typical pattern a region shows over many years. The reveal explains the time-scale clue so you build the habit of asking how much time a statement covers.
Curriculum alignment
Supports elementary and middle school Earth science. Students learn the difference between weather and climate, practice classifying examples, and explore the factors that shape climate such as latitude, elevation, distance from oceans, ocean currents, and mountains. The three modes scaffold from a guided hint to subtler statements.
The time-scale clue
Weather changes from hour to hour and day to day. Words like now, today, this morning, and tomorrow point to weather. Climate is measured over many years, usually 30 or more. Words like usually, average, every year, and over the last decade point to climate.
What shapes climate
A region's climate depends on its latitude, its elevation, how close it is to oceans, the ocean currents and winds that pass over it, and nearby mountains that can block moving air. These factors decide whether a place is typically hot or cold, wet or dry.