Fast vs Slow Earth Changes Explorer
Some Earth events happen in seconds. Others take millions of years. Explore how fast or slow our planet changes, and discover the evidence each change leaves behind.
Earth Changes Reference
Fast Earth Changes
Fast changes happen in seconds to days and are easy to witness
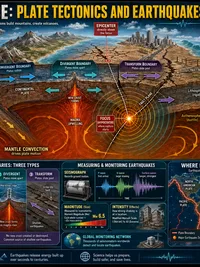
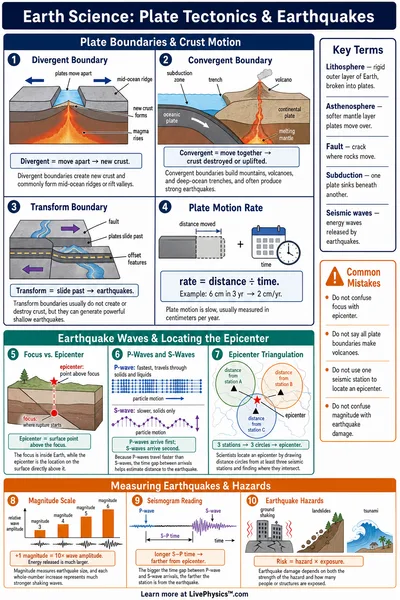
- Earthquakes shake and crack the ground in seconds
- Landslides move rocks and soil down a hill in minutes
- Flash floods reshape riverbanks in hours
- Tsunamis flood coastlines within hours of an earthquake
- Volcanic eruptions build new land in hours to days
Slow Earth Changes
Slow changes take years to millions of years but leave lasting landforms
- Glacier retreat reshapes valleys over decades to centuries
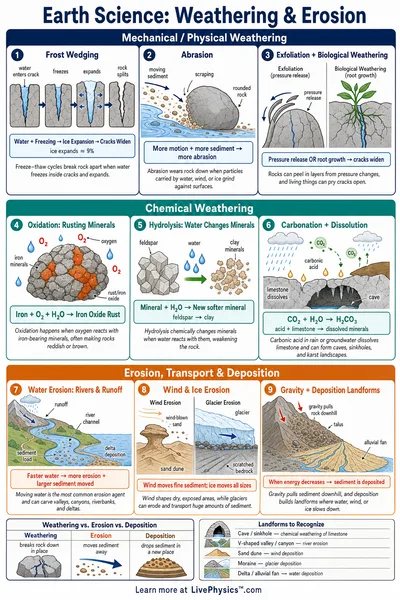
- River erosion widens valleys over thousands of years
- Soil formation builds rich soil over hundreds of years
- Canyon formation carves deep rock over millions of years
- Continental drift moves continents over millions of years
Evidence of Change
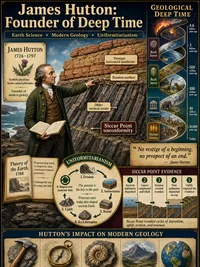
We know slow changes happened even though nobody watched them. Geologists read clues left in the landscape
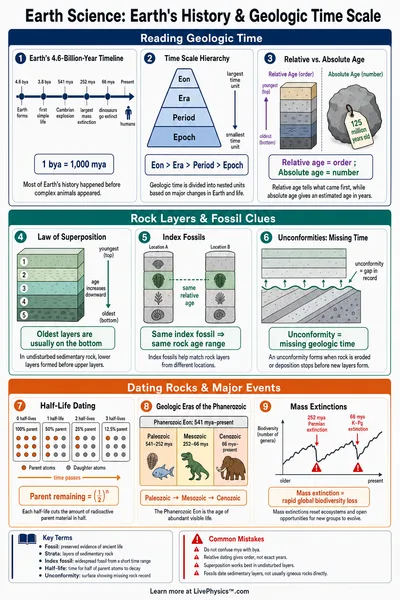
- Rock layers in canyon walls record millions of years of history
- U-shaped valleys show where glaciers once carved through mountains
- Matching fossils on different continents prove the lands were once joined
- Rounded pebbles in riverbeds show water wore down sharp edges over time
Geologic Time
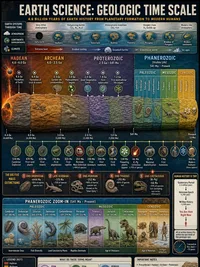
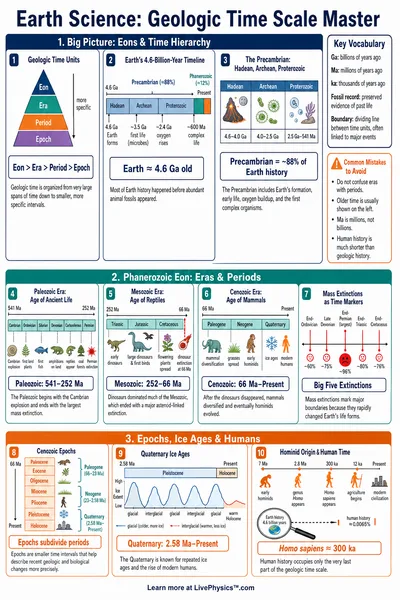
Earth is about 4.5 billion years old. Processes that seem very slow to us are actually fast compared to Earth's full history
- The Grand Canyon formed over about 5 to 6 million years
- The Himalayas are still growing a few millimeters each year
- North America and Europe drift apart about 2.5 cm per year
- A mountain range can rise and erode away completely over millions of years
Related Content
Related Tools
Earthquake Magnitude Calculator
Four modes, magnitude scales (Richter Mₗ, moment magnitude M𝑤, energy), energy comparison (each step = 31.6× more energy, logarithmic bar chart), Modified Mercalli Intensity I-XII with descriptions, and Richter magnitude from seismograph amplitude. Presets include Minor M3 through Great M8, 1906 San Francisco M7.9, and 2011 Japan M9.1.
Carbon Footprint Calculator
Estimate annual CO₂ emissions from transportation (car miles, fuel type, flights), home energy (electricity, heating, AC), diet (meat consumption, food waste), and lifestyle (shopping, recycling). Pie chart breakdown, country comparison bar chart, trees-to-offset and equivalent-driving metrics. Five presets, Average American, Eco-Conscious, Heavy Commuter, Frequent Flyer, Work from Home.
Star Lifecycle Visualizer
Three modes: interactive HR diagram with 23 real stars (click to see properties), stellar evolution pathway from nebula to end state (white dwarf, neutron star, or black hole based on initial mass), and star properties calculator (luminosity L∝M^3.5, radius, lifetime t∝M^-2.5, apparent magnitude). Six presets: Sun, Red Dwarf (0.3 M☉), Sirius A (2 M☉), Blue Giant (20 M☉), Betelgeuse (15 M☉), Supergiant (50 M☉). Includes spectral class colour strip and SVG star visualization.
H-R Diagram Explorer
Three modes, plot a single star on the Hertzsprung-Russell diagram from temperature, radius, and mass (Stefan-Boltzmann luminosity, spectral class O-M, absolute magnitude, HR region); compare multiple stars side by side; and browse the spectral atlas with typical properties for each class. 23 reference stars plotted, 6 presets from Proxima Centauri to Rigel.
Related Labs
Fast vs Slow Earth Changes Lab
Sort Earth events by speed, explore before-and-after change sequences, and simulate rock weathering through Rain, Wind, and Ice agents. NGSS 4-ESS2-1. Grades 3–5.
Earth History Lab
Calculate rock ages using radiometric dating with C-14, K-40, U-238, and Rb-87 isotope systems. Measure plate motion rates from magnetic reversal distances and predict future ocean widths
Soil Conservation Lab
Measure how slope steepness and conservation practices affect erosion rates using the USLE. Progressively add cover crops, contour farming, terracing, and buffer strips to reduce soil loss
Earthquake Feed Map
Explore real earthquake data from the USGS. Filter by magnitude, depth, and region. See the Pacific Ring of Fire and other plate boundaries light up with seismic activity