Practice reading phase diagrams and heating curves, identifying phase changes, and calculating heat energy during temperature changes and phase transitions.
Read each problem carefully. Show your work in the space provided. Use units in your answers when calculations are required.
Interpreting phase changes, temperature plateaus, and pressure-temperature graphs
Chemistry - Grade 9-12
- 1
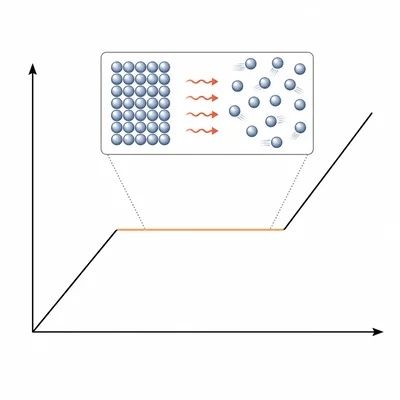
On a heating curve for a pure substance, the temperature stays constant during melting even though heat is being added. Explain why the temperature does not increase during this part of the curve.
- 2
A substance is heated from 20 °C to 80 °C while remaining a liquid. Its mass is 50.0 g and its specific heat as a liquid is 2.40 J/g°C. How much heat is absorbed?
- 3
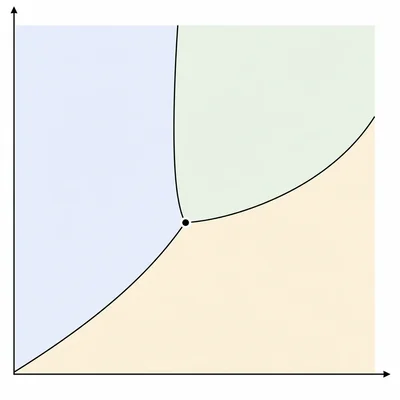
A phase diagram shows a point where solid, liquid, and gas phases all meet. What is this point called, and what does it represent?
- 4
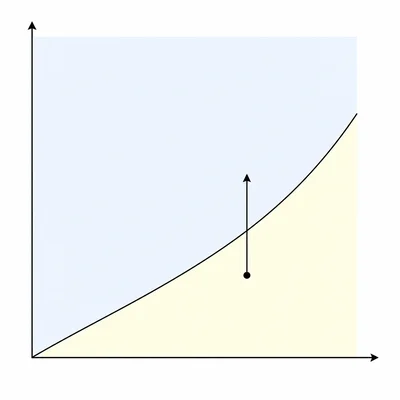
On a typical phase diagram, what happens to a substance if pressure is increased at constant temperature and the starting point is in the gas region near the gas-liquid boundary?
- 5
A 25.0 g sample of ice at 0 °C melts completely at 0 °C. The heat of fusion of water is 334 J/g. How much heat is required?
- 6
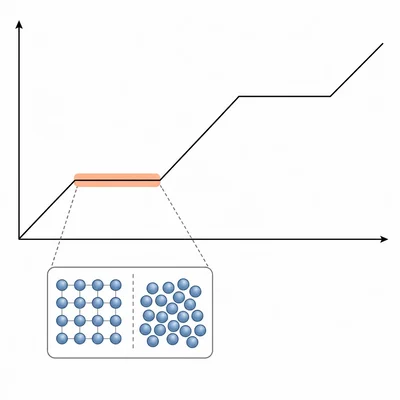
Identify the phase or phases present during the first flat section of a heating curve for a substance that starts as a solid and is heated until it becomes a gas.
- 7
A liquid reaches its normal boiling point at 95 °C. What does the word normal mean in this context?
- 8
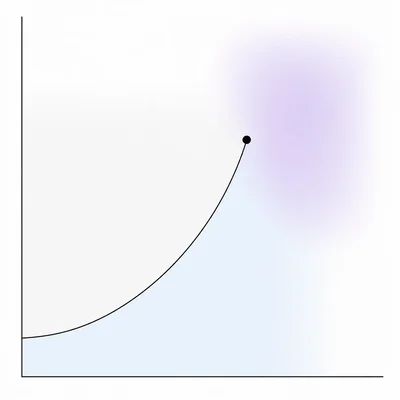
A phase diagram has pressure on the y-axis and temperature on the x-axis. The boundary between the liquid and gas regions ends at a labeled point. What is this point called, and what happens beyond it?
- 9
A 100.0 g sample of water is heated from 25.0 °C to 100.0 °C. The specific heat of liquid water is 4.18 J/g°C. Calculate the heat absorbed before boiling begins.
- 10
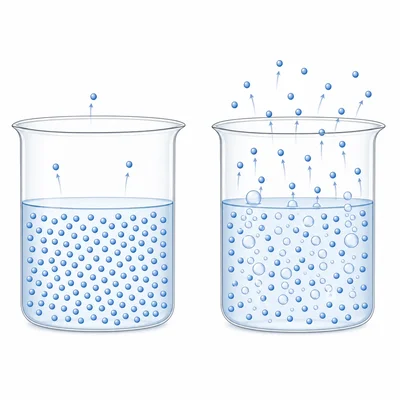
Explain the difference between evaporation and boiling using particle behavior and where vaporization occurs.
- 11
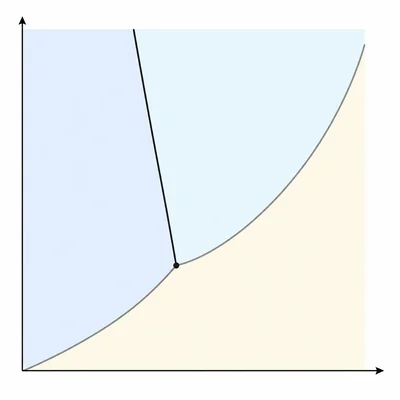
On a phase diagram for water, the solid-liquid boundary slopes to the left. What does this unusual slope mean about the effect of pressure on the melting point of ice?
- 12
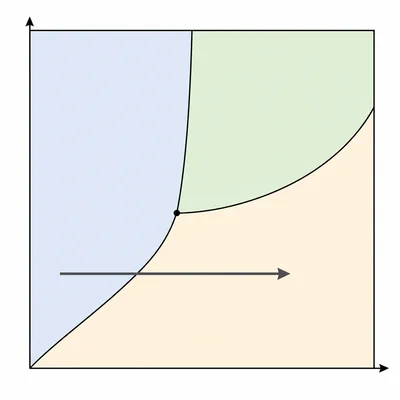
A substance is at a temperature and pressure in the solid region of its phase diagram. The pressure is kept constant while temperature is increased until the substance enters the gas region without passing through the liquid region. What phase change occurred?
- 13
A 40.0 g sample of a substance vaporizes at its boiling point. Its heat of vaporization is 850 J/g. How much heat is absorbed during vaporization?
- 14
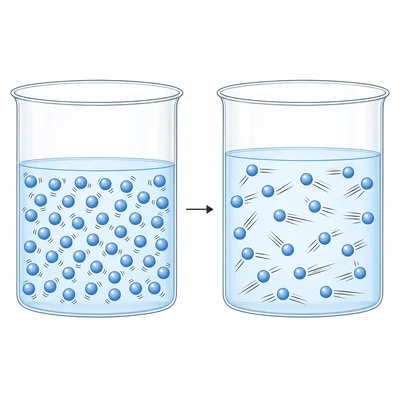
Describe what is happening to particle motion and particle spacing during the sloped liquid section of a heating curve.
- 15
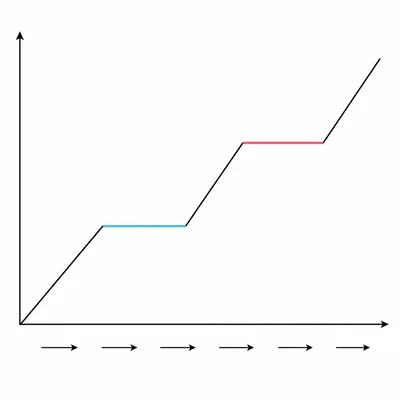
A student says, "Adding heat to a substance always increases its temperature." Use heating curves to explain why this statement is not always correct.