Solubility Curve Investigation Lab
Build the solubility curve for seven preset solutes by recording S at six temperatures from 0 to 100 °C. Fit a line, classify the dissolution, compare two curves, or predict the mass that crystallizes when cooling a saturated solution.
Choose an Investigation
Investigation A. Single Solute Curve
How does the solubility of a chosen solute change with temperature, and what does the slope of solubility vs T reveal about the enthalpy of dissolution?
Temperature T sampled at 0, 20, 40, 60, 80, 100 °C
Solubility S in g solute per 100 g water
- Solute identity (fixed for this curve)
- Mass of water (100 g) used per trial
- Purity of solute and stirring rate
Predict whether the solute dissolves endothermically (positive slope) or exothermically (negative slope). Estimate the slope in g per 100 g water per °C.
Most ionic salts show a positive slope (dissolution is endothermic). NaCl is nearly flat. A small number of salts (e.g. Ce₂(SO₄)₃) show negative slopes (exothermic dissolution).
- Pick a solute and click Record Trial once per temperature in the grid
- Plot S vs T and fit a straight line (or note curvature in residuals)
- Use the slope to classify the dissolution as endothermic, exothermic, or nearly flat
- Use the curve to predict S at an intermediate temperature
Setup
Click Record Trial once per temperature in the 0 / 20 / 40 / 60 / 80 / 100 °C grid. Six trials build the full curve.
Next trial preview
- Solute: KNO₃
- T = 0 °C
- Published S = 13.30 g/100g
- Trials so far: 0 / 6
Curve Analysis
Solubility S (g/100g H₂O) vs Temperature T (°C)
Record trials (or load sample data) to plot the curve.
Data Table
(0 rows)| # | Trial | Solute | Temperature T(°C) | Solubility(g/100g H₂O) |
|---|
Reference Guide
What a Solubility Curve Shows
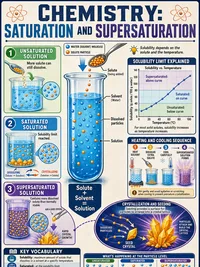
A solubility curve plots the maximum mass of solute that dissolves in 100 g of water versus temperature. Points on the curve are saturated solutions; points below are unsaturated; points above are supersaturated and unstable.
- Positive slope means dissolution is endothermic
- Negative slope means dissolution is exothermic
- Flat curve means temperature has little effect
Linear Regression on S vs T
Fit S to a straight line over the recorded temperatures.
The slope m tells you how strongly solubility depends on temperature. R² close to 1 means a linear model is a good description; lower R² and U-shaped residuals indicate a curved relationship (most ionic salts curve upward).
Comparative Curves
Two curves can cross within the sampled range. The crossover temperature is where the two solutes have equal solubility. NaCl and KCl cross between 25 and 40 °C. KNO₃ and NaCl do not cross within 0 to 100 °C.
A large slope difference between two curves means fractional crystallization is a viable separation technique.
Recrystallization
For a sample mass m dissolved in 100 g water at T_hot then cooled to T_cold, the mass that crystallizes is
Slow cooling keeps the solution near equilibrium so the actual yield matches the prediction within a few percent. Fast cooling can supersaturate, delaying crystallization.