Statistics
Misreading the Quartiles on a Box Plot
Students read the ends of the whiskers as the first and third quartiles instead of reading the edges of the box.
Quick check
Why students make it
A box plot has five marked values, so students often treat the far left, middle, and far right as the quartiles. The whiskers look important, but they show the minimum and maximum, not and .
The rule done right
On a box plot, is the left edge of the box, the median is the line inside the box, and is the right edge of the box. The whisker ends show the minimum and maximum values.
Related resources
-
 Statistics, Computing Quartiles and the IQR Infographic
-
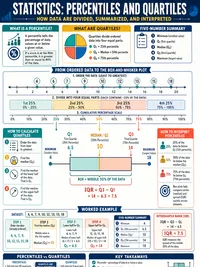 Percentiles and Quartiles Infographic
-
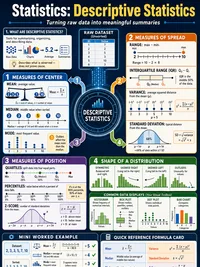 Descriptive Statistics Infographic
-
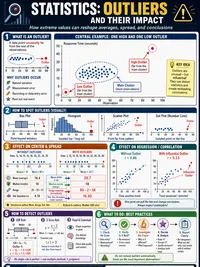 Outliers and Their Impact Infographic
-
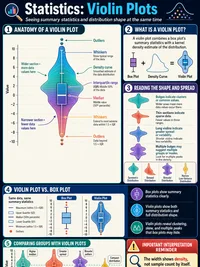 Statistics, Violin Plots Infographic
- Five-Number Summary & Box Plot Reference Cheat Sheet
- Quartiles, Percentiles & IQR Cheat Sheet
- Descriptive Statistics Cheat Sheet
- Data Visualization & Reading Graphs Cheat Sheet
- Statistics, Box-and-Whisker Plots Worksheet
- Statistics, Descriptive Statistics (High School) Worksheet
- Statistics, Descriptive Statistics Worksheet
- Statistics, Range and Outliers Worksheet
- Box Plot Builder Tool
- Percentile Calculator Tool
- Descriptive Statistics Calculator Tool
- Mean, Median & Mode Explorer Tool
- Exploratory Data & Distribution Lab Lab
- Mean, Median & Mode Lab Lab
- ANOVA & Experimental Design Lab Lab