Sign in to save

Bookmark this page so you can find it later.

Sign in to save

Bookmark this page so you can find it later.

Earthquake Wave Simulator

Click an epicenter to watch P-waves and S-waves travel across Earth. Place a seismograph station to measure arrival times and explore the shadow zones created by Earth's liquid outer core.

Step 1: Click on the map to place the earthquake epicenter.
6.0
Time:00:00

Seismic Wave Science

P-Waves and S-Waves

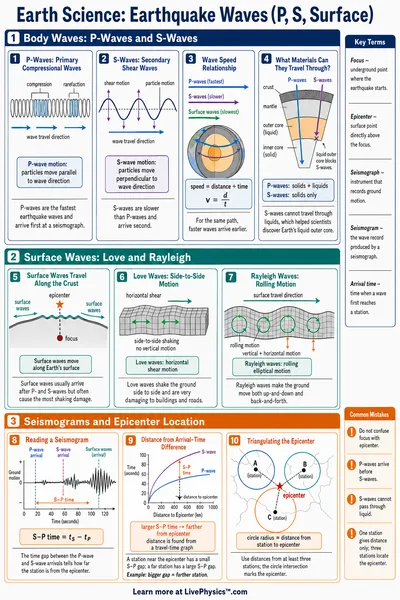
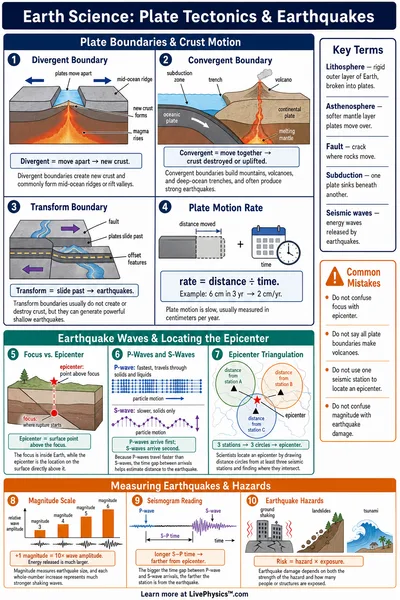
P-waves (primary) are compressional and travel at about 8 km/s through rock. S-waves (secondary) are shear waves traveling at 4.5 km/s. P-waves arrive first at any seismograph station, S-waves arrive later.

The S-P Gap

The time difference between S and P wave arrivals tells seismologists the distance to the epicenter. With readings from three stations they can pinpoint the earthquake's exact location using triangulation.

Shadow Zones

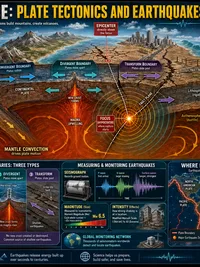
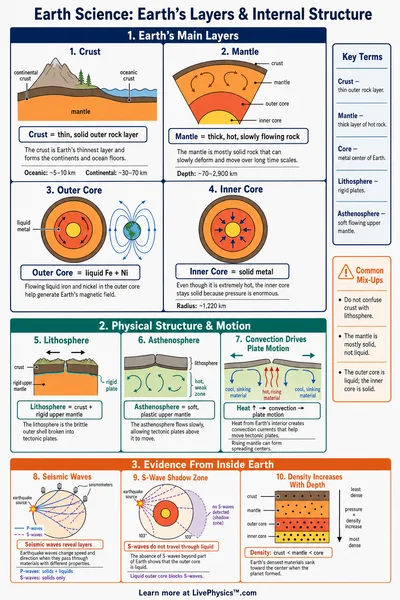
Earth's liquid outer core blocks S-waves entirely, creating a shadow zone beyond 104 degrees. P-waves are refracted by the core, creating a P-wave shadow from 104 to 140 degrees. These zones provided key evidence that Earth has a liquid outer core.

Wave Speed Contrast

P-waves travel at roughly 8 km/s through the mantle. S-waves travel at about 4.5 km/s. The difference means that for every 100 km of distance, the S-P gap grows by about 9 seconds, giving seismologists a reliable distance ruler.

Earthquake Magnitude

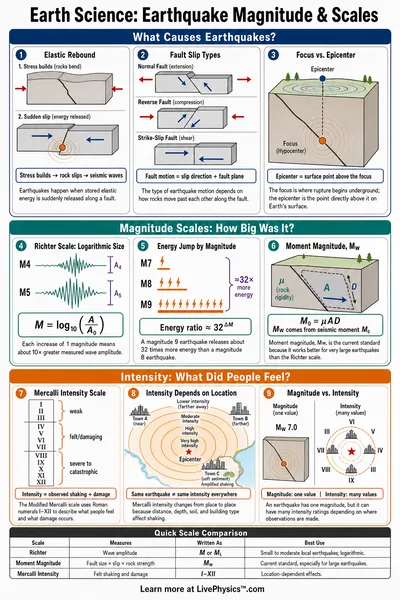
The Richter scale and moment magnitude scale measure earthquake energy logarithmically. Each whole number increase represents about 32 times more energy released. The magnitude slider in this simulator affects the visual thickness of the wave rings.

Earth's Internal Structure

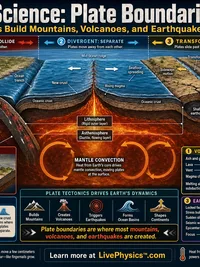
The shadow zone pattern was instrumental in revealing that Earth has a liquid outer core between 2890 and 5150 km depth. S-waves require a solid medium to travel, so their absence in the shadow zone confirmed that the outer core is molten iron.
Related Content

Related Tools

Earthquake Magnitude Calculator
Four modes: magnitude scales (Richter Mₗ, moment magnitude M𝑤, energy), energy comparison (each step = 31.6× more energy, logarithmic bar chart), Modified Mercalli Intensity I-XII with descriptions, and Richter magnitude from seismograph amplitude. Presets include Minor M3 through Great M8, 1906 San Francisco M7.9, and 2011 Japan M9.1.
Carbon Footprint Calculator
Estimate annual CO₂ emissions from transportation (car miles, fuel type, flights), home energy (electricity, heating, AC), diet (meat consumption, food waste), and lifestyle (shopping, recycling). Pie chart breakdown, country comparison bar chart, trees-to-offset and equivalent-driving metrics. Five presets: Average American, Eco-Conscious, Heavy Commuter, Frequent Flyer, Work from Home.
Star Lifecycle Visualizer
Three modes: interactive HR diagram with 23 real stars (click to see properties), stellar evolution pathway from nebula to end state (white dwarf, neutron star, or black hole based on initial mass), and star properties calculator (luminosity L∝M^3.5, radius, lifetime t∝M^-2.5, apparent magnitude). Six presets: Sun, Red Dwarf (0.3 M☉), Sirius A (2 M☉), Blue Giant (20 M☉), Betelgeuse (15 M☉), Supergiant (50 M☉). Includes spectral class colour strip and SVG star visualization.
H-R Diagram Explorer
Three modes: plot a single star on the Hertzsprung-Russell diagram from temperature, radius, and mass (Stefan-Boltzmann luminosity, spectral class O-M, absolute magnitude, HR region); compare multiple stars side by side; and browse the spectral atlas with typical properties for each class. 23 reference stars plotted, 6 presets from Proxima Centauri to Rigel.