Geologic Time Scale Explorer
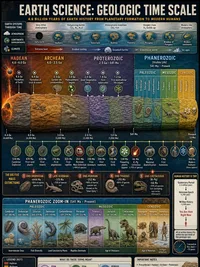
Explore Earth's history through the geologic time scale. Browse a scaled timeline of eons, eras, and periods, read the major events and life of each interval, and test yourself with a quiz.
Earth's Timeline
Click any intervalThe Precambrian covers about 88 percent of Earth's history. It is shown compressed here so the Phanerozoic events stay readable.
Mesozoic Era
252 to 66 Mya (186 million years long)
Part of the .
Middle life, the age of dinosaurs. Spans roughly 252 to 66 Mya. Mammals, birds, and flowering plants also arise here.
Major events and life
- The age of dinosaurs
- First mammals and first birds appear
- Flowering plants spread across the land
- Ends with the K-Pg mass extinction that killed the non bird dinosaurs
Periods within
How it works
The timeline is split into two parts. The Precambrian, which is about 88 percent of Earth's history, is shown compressed so it does not crowd out the rest. The Phanerozoic Eon is scaled by the real duration of each period, so longer periods appear as taller bands. Click any eon, era, or period to read its age range in millions of years ago and the major events and life of that time. Switch to Quiz Mode to match events such as the Cambrian explosion or the extinction of the dinosaurs to the correct interval.
Curriculum alignment
This tool supports middle school and high school Earth science units on Earth's history, the fossil record, and the history of life. It connects to NGSS topics on the geologic time scale (MS-ESS1-4 and HS-ESS1-5), including how rock layers and fossils record relative ages and how major events like mass extinctions and the rise of new groups of organisms mark the boundaries between intervals.
Reference Guide to the Geologic Time Scale
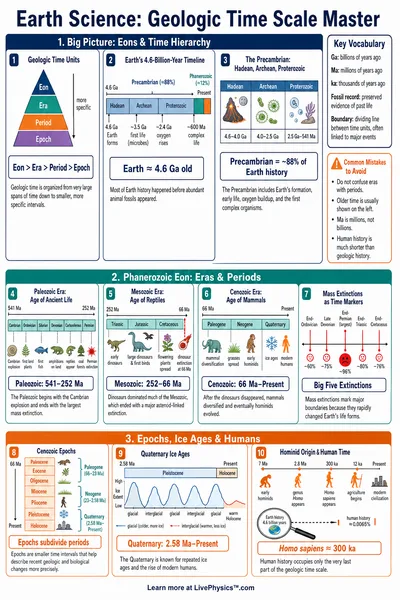
The Four Eons
Geologic time is split into eons. The Hadean (4600 to 4000 Mya) is when Earth formed. The Archean (4000 to 2500 Mya) saw the first life. The Proterozoic (2500 to 541 Mya) saw oxygen build up and the first complex cells. The Phanerozoic (541 Mya to today) is the eon of visible animal life.
The Three Eras
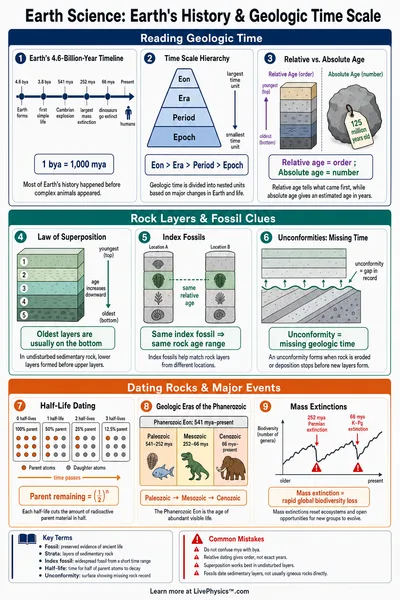
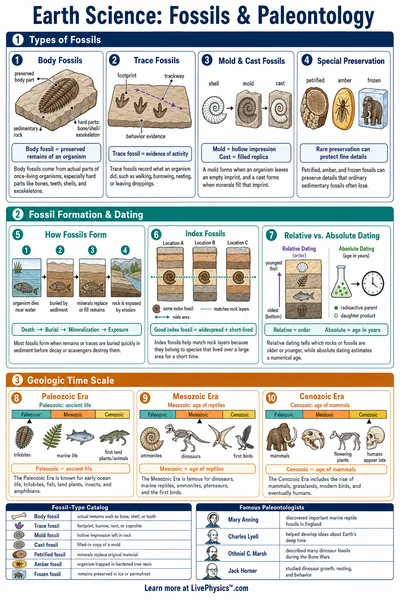
The Phanerozoic Eon holds three eras. The Paleozoic (541 to 252 Mya) is old life, ending in the largest extinction ever. The Mesozoic (252 to 66 Mya) is the age of dinosaurs. The Cenozoic (66 Mya to today) is the age of mammals, and the time when humans appear.
Periods of the Phanerozoic
Each era is divided into periods, from the Cambrian through the Quaternary. Periods are defined by the kinds of life that lived then and by major events, such as the Cambrian explosion, the first forests of the Devonian, and the coal swamps of the Carboniferous.
Mass Extinctions
Several boundaries are marked by mass extinctions. The Permian extinction (about 252 Mya) ended the Paleozoic and was the most severe ever. The K-Pg extinction (about 66 Mya) ended the Mesozoic and the non bird dinosaurs, likely triggered by a large asteroid impact.
Reading the Fossil Record
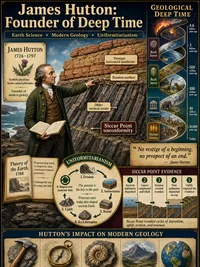
Scientists place events in time using rock layers and the fossils inside them. Deeper layers are usually older. Index fossils that lived during a short, well known span help match the ages of rocks in different places. Radiometric dating then gives ages in millions of years.
A Sense of Scale
If all of Earth's history were squeezed into one year, single celled life would appear in late winter, animals with shells around mid November, the dinosaurs would die out on December 26, and all of recorded human history would fit into the last few seconds before midnight.