Sign in to save

Bookmark this page so you can find it later.

Sign in to save

Bookmark this page so you can find it later.

Atmosphere Structure Explorer

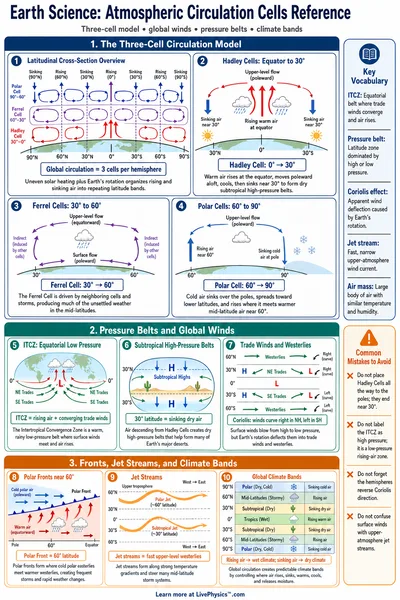
Four modes covering atmosphere layers, temperature inversions, ozone distribution with UV absorption, and Earth's energy balance. Adjust altitude, surface temperature, albedo, and CO₂ levels to see how the atmosphere responds.

Atmosphere Profile

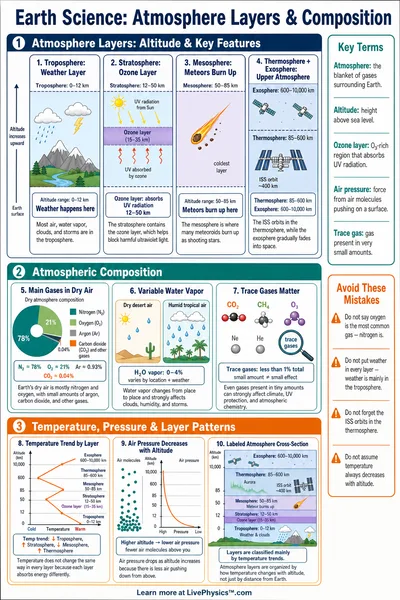
TroposphereStratosphereMesosphereThermosphere020406080100180 K220 K260 K300 KTemperature (K)Altitude (km)5.0 km - Troposphere255.6 K / 54.0 kPa

Controls

km
K

Results

Troposphereat 5.0 km
T=255.6 KP=54.02 kPaT = 255.6 \text{ K} \quad P = 54.02 \text{ kPa}
Temperature
255.6 K
-17.5 °C
Pressure
54.02 kPa
Density
0.736 kg/m³
Gas Composition (% by volume)
N₂
78.08%
O₂
20.95%
Ar
0.93%
CO₂
0.04%
H₂O
0.58%
O₃
0%

Temperature vs Altitude

Pressure vs Altitude

Reference Guide

Lapse Rate

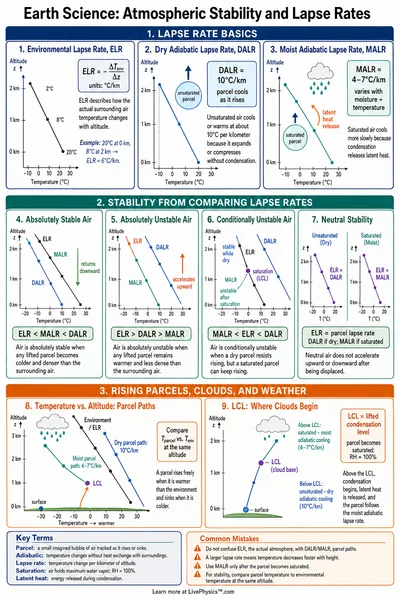
Temperature changes with altitude at a rate called the environmental lapse rate. In the troposphere, temperature decreases at roughly 6.5 K per kilometer.

T=T0ΓhT = T_0 - \Gamma \cdot h

where T₀ is the surface temperature, Γ is the lapse rate (K/km), and h is the altitude in km. The tropopause at 11 km marks the transition to the stratosphere where temperature increases due to ozone absorption of UV.

Barometric Formula

Atmospheric pressure decreases exponentially with altitude. The barometric formula accounts for temperature variation through the lapse rate.

P=P0(1ΓhT0)gMRΓP = P_0 \left(1 - \frac{\Gamma h}{T_0}\right)^{\frac{gM}{R\Gamma}}

where g = 9.81 m/s², M = 0.029 kg/mol (air molar mass), and R = 8.314 J/(mol·K). Pressure drops to roughly half every 5.5 km.

Air Quality Index (AQI)

The EPA Air Quality Index converts pollutant concentrations to a 0-500 scale using breakpoint interpolation.

AQI=IhiIloChiClo(CClo)+Ilo\mathrm{AQI} = \frac{I_{\mathrm{hi}} - I_{\mathrm{lo}}}{C_{\mathrm{hi}} - C_{\mathrm{lo}}} \left(C - C_{\mathrm{lo}}\right) + I_{\mathrm{lo}}

Temperature inversions trap pollutants near the surface by capping vertical mixing. The ventilation coefficient (mixing height × wind speed) determines how well pollutants disperse.

Energy Balance

Earth's energy budget balances incoming solar radiation against outgoing thermal emission. The greenhouse effect traps a fraction of the outgoing infrared.

Eout=σT4(Stefan-Boltzmann)E_{\mathrm{out}} = \sigma T^4 \quad (\text{Stefan-Boltzmann})

Albedo (reflectivity) determines how much sunlight is reflected back to space. Ice and clouds increase albedo, while forests and oceans decrease it. Doubling CO₂ increases greenhouse trapping by roughly 4 W/m².
Related Content

Related Tools

Earthquake Magnitude Calculator
Four modes: magnitude scales (Richter Mₗ, moment magnitude M𝑤, energy), energy comparison (each step = 31.6× more energy, logarithmic bar chart), Modified Mercalli Intensity I-XII with descriptions, and Richter magnitude from seismograph amplitude. Presets include Minor M3 through Great M8, 1906 San Francisco M7.9, and 2011 Japan M9.1.
Carbon Footprint Calculator
Estimate annual CO₂ emissions from transportation (car miles, fuel type, flights), home energy (electricity, heating, AC), diet (meat consumption, food waste), and lifestyle (shopping, recycling). Pie chart breakdown, country comparison bar chart, trees-to-offset and equivalent-driving metrics. Five presets: Average American, Eco-Conscious, Heavy Commuter, Frequent Flyer, Work from Home.
Star Lifecycle Visualizer
Three modes: interactive HR diagram with 23 real stars (click to see properties), stellar evolution pathway from nebula to end state (white dwarf, neutron star, or black hole based on initial mass), and star properties calculator (luminosity L∝M^3.5, radius, lifetime t∝M^-2.5, apparent magnitude). Six presets: Sun, Red Dwarf (0.3 M☉), Sirius A (2 M☉), Blue Giant (20 M☉), Betelgeuse (15 M☉), Supergiant (50 M☉). Includes spectral class colour strip and SVG star visualization.
H-R Diagram Explorer
Three modes: plot a single star on the Hertzsprung-Russell diagram from temperature, radius, and mass (Stefan-Boltzmann luminosity, spectral class O-M, absolute magnitude, HR region); compare multiple stars side by side; and browse the spectral atlas with typical properties for each class. 23 reference stars plotted, 6 presets from Proxima Centauri to Rigel.