Sign in to save

Bookmark this page so you can find it later.

Sign in to save

Bookmark this page so you can find it later.

Earthquake Epicenter Triangulation

Enter P-wave and S-wave arrival times at three seismograph stations. The tool calculates the distance from each station and draws overlapping circles. The point where all three circles intersect is the earthquake epicenter.

Presets:
Triangulation Map700 x 600 km grid
01002003004005006007000100200300400500600East-West (km)North-South (km)52 km39 km70 kmAlphaBetaGamma100 kmStationEpicenter
A
Station Alpha52.1 km away
PS
S-P diff: 6.20 sDistance: 52.1 km
B
Station Beta39.5 km away
PS
S-P diff: 4.70 sDistance: 39.5 km
C
Station Gamma69.7 km away
PS
S-P diff: 8.30 sDistance: 69.7 km

Computed Results

A
Station Alpha
52.1 km
S-P: 6.20 s
B
Station Beta
39.5 km
S-P: 4.70 s
C
Station Gamma
69.7 km
S-P: 8.30 s
?Epicenter
X position
324.3 km
Y position
372.0 km
Origin time
t = 3.87 s
Convergence
Approximate
Method. The S-P time difference at each station determines distance using: d = (t_S - t_P) x V_P x V_S / (V_P - V_S). Three overlapping circles uniquely locate the epicenter.

How Seismic Triangulation Works

P-waves and S-waves

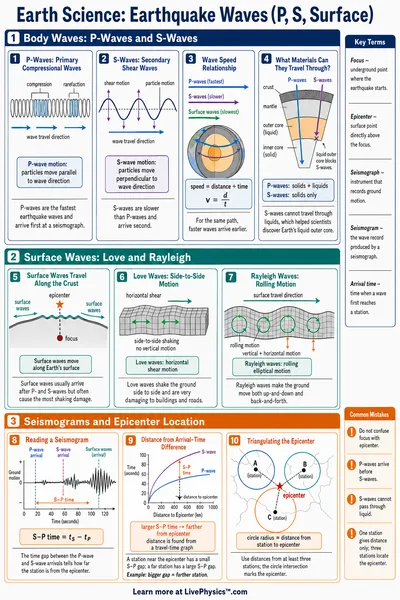
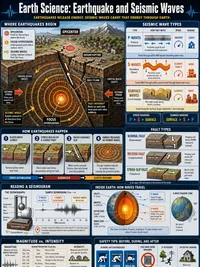
Earthquakes produce two main body waves. P-waves (primary) are compressional waves that travel at about 6 km/s through the crust. S-waves (secondary) are shear waves moving at roughly 3.5 km/s. Because P-waves travel faster, they always arrive at a seismograph first. The difference in arrival times grows with distance from the epicenter.

The S-P Distance Formula

The distance from a station to the epicenter is calculated from the S-P time difference using: d = (t_S - t_P) x V_P x V_S / (V_P - V_S). With V_P = 6.0 km/s and V_S = 3.5 km/s, the factor simplifies to 8.4 km per second of S-P delay. A 10-second S-P difference means the epicenter is about 84 km away.

Three-Station Triangulation

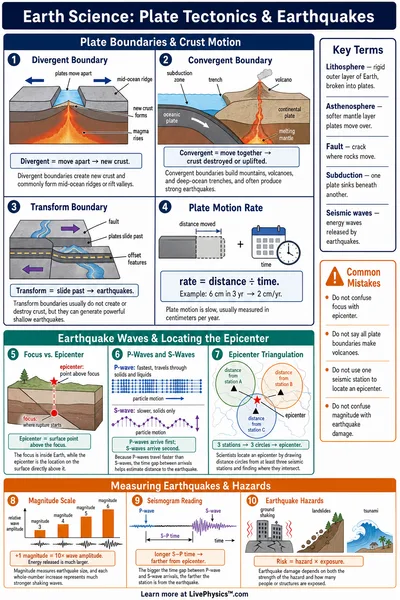
Each station defines a circle centered on itself with radius equal to the computed distance. One station alone only narrows the epicenter to a circle. Two stations give two possible intersection points. Three stations uniquely identify the epicenter as the single point where all three circles overlap. Stations should be spread far apart for an accurate fix.

Richter Scale Basics

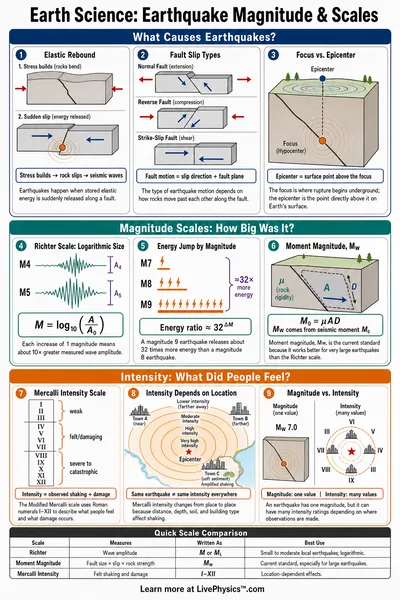
The Richter scale measures earthquake magnitude on a base-10 logarithmic scale. A magnitude 5 earthquake releases about 31 times more energy than a magnitude 4. Most earthquakes people feel are in the 3-5 range. Magnitude 6-7 can cause significant damage. Events above magnitude 8 are major earthquakes capable of affecting large regions. Magnitude is estimated from ground motion amplitude corrected for distance.

Real Seismic Networks

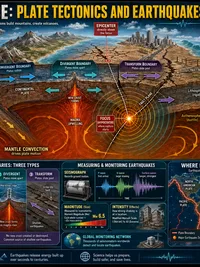
Global seismic networks like the USGS and IRIS maintain hundreds of stations worldwide. Modern seismographs record ground motion in three components (vertical, north-south, east-west) with precision below a nanometer. Automated algorithms triangulate epicenters within minutes of an event. Dense regional networks can locate small earthquakes to within a few kilometers.
Related Content

Related Tools

Earthquake Magnitude Calculator
Four modes: magnitude scales (Richter Mₗ, moment magnitude M𝑤, energy), energy comparison (each step = 31.6× more energy, logarithmic bar chart), Modified Mercalli Intensity I-XII with descriptions, and Richter magnitude from seismograph amplitude. Presets include Minor M3 through Great M8, 1906 San Francisco M7.9, and 2011 Japan M9.1.
Carbon Footprint Calculator
Estimate annual CO₂ emissions from transportation (car miles, fuel type, flights), home energy (electricity, heating, AC), diet (meat consumption, food waste), and lifestyle (shopping, recycling). Pie chart breakdown, country comparison bar chart, trees-to-offset and equivalent-driving metrics. Five presets: Average American, Eco-Conscious, Heavy Commuter, Frequent Flyer, Work from Home.
Star Lifecycle Visualizer
Three modes: interactive HR diagram with 23 real stars (click to see properties), stellar evolution pathway from nebula to end state (white dwarf, neutron star, or black hole based on initial mass), and star properties calculator (luminosity L∝M^3.5, radius, lifetime t∝M^-2.5, apparent magnitude). Six presets: Sun, Red Dwarf (0.3 M☉), Sirius A (2 M☉), Blue Giant (20 M☉), Betelgeuse (15 M☉), Supergiant (50 M☉). Includes spectral class colour strip and SVG star visualization.
H-R Diagram Explorer
Three modes: plot a single star on the Hertzsprung-Russell diagram from temperature, radius, and mass (Stefan-Boltzmann luminosity, spectral class O-M, absolute magnitude, HR region); compare multiple stars side by side; and browse the spectral atlas with typical properties for each class. 23 reference stars plotted, 6 presets from Proxima Centauri to Rigel.