Map Patterns & Landforms Explorer
Physical maps tell the story of how water and time shaped the land. Explore mountains, valleys, plains, deltas, and more -- then discover what forces created each one.
Landforms Reference
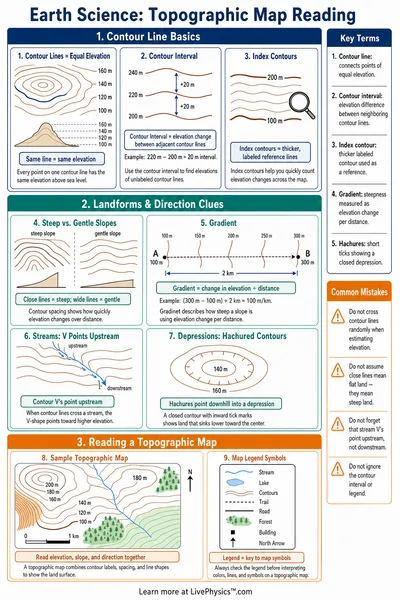
Reading Physical Maps
Colors and symbols on physical maps show elevation and water
- Brown or dark shading shows high elevation (mountains, plateaus)
- Green shows low, flat land (plains, valleys)
- Blue shows water (rivers, lakes, oceans)
- Contour lines show how steeply elevation changes
- Sandy colors often show coasts or dry areas
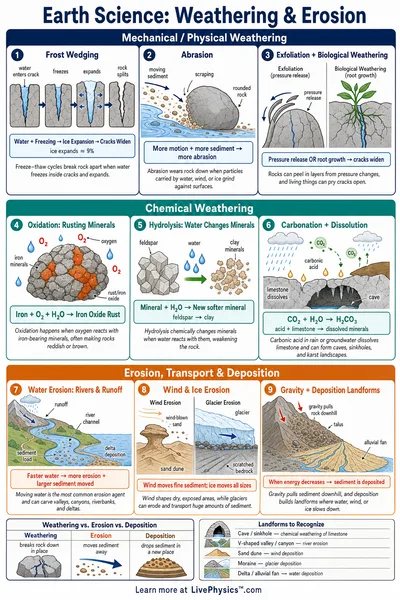
Water Shapes Land
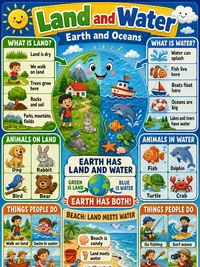
Moving water is one of the most powerful forces shaping Earth's surface
- Rivers carve valleys and canyons over millions of years
- Rivers deposit sediment to build deltas and plains
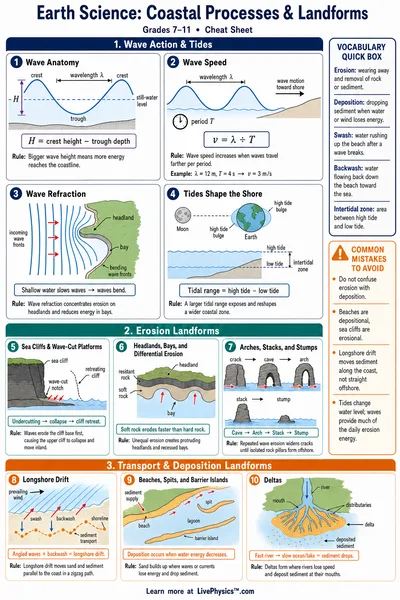
- Ocean waves erode coasts and shape beaches
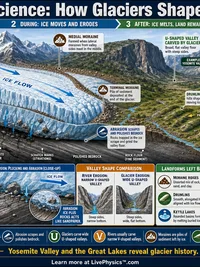
- Glaciers carve wide U-shaped valleys (not V-shaped like rivers)
Landforms Take Time
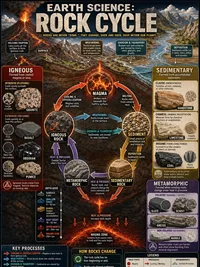
Most landforms form very slowly through natural processes
- The Grand Canyon took about 5 to 6 million years to form
- The Mississippi River Delta has been growing for about 7,000 years
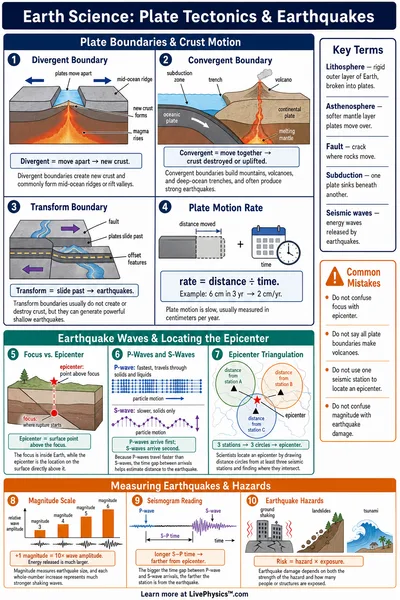
- Mountain ranges take tens of millions of years to rise
- Coastal erosion can move a shoreline just centimeters per year
Eight Major Landforms
- 🏔️ Mountain -- tall peak formed by volcanic or tectonic activity
- 🏞️ Valley -- low area carved by rivers or glaciers
- 🌾 Plain -- wide flat area from sediment deposits
- 🏖️ Coast -- land where it meets the ocean
- 🌊 Delta -- fan-shaped river mouth deposit
- 🏜️ Canyon -- deep narrow cut made by a river
- 🗺️ Peninsula -- land surrounded by water on three sides
- 🏝️ Island -- land completely surrounded by water
Related Content
Related Tools
Earthquake Magnitude Calculator
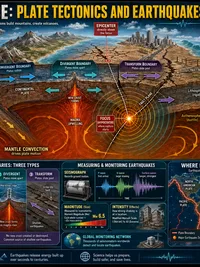
Four modes, magnitude scales (Richter Mₗ, moment magnitude M𝑤, energy), energy comparison (each step = 31.6× more energy, logarithmic bar chart), Modified Mercalli Intensity I-XII with descriptions, and Richter magnitude from seismograph amplitude. Presets include Minor M3 through Great M8, 1906 San Francisco M7.9, and 2011 Japan M9.1.
Carbon Footprint Calculator
Estimate annual CO₂ emissions from transportation (car miles, fuel type, flights), home energy (electricity, heating, AC), diet (meat consumption, food waste), and lifestyle (shopping, recycling). Pie chart breakdown, country comparison bar chart, trees-to-offset and equivalent-driving metrics. Five presets, Average American, Eco-Conscious, Heavy Commuter, Frequent Flyer, Work from Home.
Star Lifecycle Visualizer
Three modes: interactive HR diagram with 23 real stars (click to see properties), stellar evolution pathway from nebula to end state (white dwarf, neutron star, or black hole based on initial mass), and star properties calculator (luminosity L∝M^3.5, radius, lifetime t∝M^-2.5, apparent magnitude). Six presets: Sun, Red Dwarf (0.3 M☉), Sirius A (2 M☉), Blue Giant (20 M☉), Betelgeuse (15 M☉), Supergiant (50 M☉). Includes spectral class colour strip and SVG star visualization.
H-R Diagram Explorer
Three modes, plot a single star on the Hertzsprung-Russell diagram from temperature, radius, and mass (Stefan-Boltzmann luminosity, spectral class O-M, absolute magnitude, HR region); compare multiple stars side by side; and browse the spectral atlas with typical properties for each class. 23 reference stars plotted, 6 presets from Proxima Centauri to Rigel.
Related Labs
Landforms & Map Reading Lab
Identify major landforms, read a map using symbols and a key, and explore how elevation changes from sea level to a mountain peak. NGSS 4-ESS2-2. Grades 3–5.
Fast vs Slow Earth Changes Lab
Sort Earth events by speed, explore before-and-after change sequences, and simulate rock weathering through Rain, Wind, and Ice agents. NGSS 4-ESS2-1. Grades 3–5.
Earthquake Feed Map
Explore real earthquake data from the USGS. Filter by magnitude, depth, and region. See the Pacific Ring of Fire and other plate boundaries light up with seismic activity